
Page 55 - Physical chemistry understanding our chemical world
P. 55
22 INTRODUCTION TO PHYSICAL CHEMISTRY
Lord Kelvin (1824–1907) was a great thermodynamicist whom we shall meet quite
often in these pages. He noticed how the relationship in Equation (1.5) resembles the
equation of a straight line, i.e. takes the form
y = mx + c
(1.6)
observed gradient controlled constant
variable variable
except without an intercept, i.e. c = 0. Kelvin obtained good-quality data for the
volume of a variety of gases as a function of temperature, and plotted graphs of
volume V (as y) against temperature T (as x) for each; curiously, however, he was
unable to draw a graph with a zero intercept for any of them.
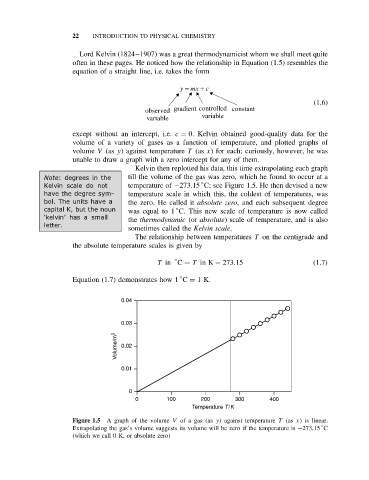
Kelvin then replotted his data, this time extrapolating each graph
Note: degrees in the till the volume of the gas was zero, which he found to occur at a
◦
Kelvin scale do not temperature of −273.15 C; see Figure 1.5. He then devised a new
have thedegreesym- temperature scale in which this, the coldest of temperatures, was
bol. The units have a the zero. He called it absolute zero, and each subsequent degree
capital K, but the noun was equal to 1 C. This new scale of temperature is now called
◦
‘kelvin’ has a small
the thermodynamic (or absolute) scale of temperature, and is also
letter.
sometimes called the Kelvin scale.
The relationship between temperatures T on the centigrade and
the absolute temperature scales is given by
◦
T in C = T in K − 273.15 (1.7)
◦
Equation (1.7) demonstrates how 1 C = 1K.
0.04
0.03
Volume/m 3 0.02
0.01
0
0 100 200 300 400
Temperature T/K
Figure 1.5 A graph of the volume V of a gas (as y) against temperature T (as x) is linear.
◦
Extrapolating the gas’s volume suggests its volume will be zero if the temperature is −273.15 C
(which we call 0 K, or absolute zero)