
Page 235 - Physical Chemistry
P. 235
lev38627_ch07.qxd 3/14/08 12:51 PM Page 216
216
Chapter 7 since dP/P d ln P. Note the resemblance to the van’t Hoff equation (6.36). Equation
One-Component Phase Equilibrium (7.19) does not hold at temperatures near the critical temperature T , where the gas
and Surfaces c
density is high, the vapor is far from ideal, and the liquid’s volume is not negligible
compared with the gas’s volume. Equation (7.19) is called the Clausius–Clapeyron
equation in most physical chemistry texts. However, most physics and engineering
thermodynamics texts use the name Clausius–Clapeyron equation to refer to Eq. (7.18).
2
Since d(1/T) (1/T ) dT, Eq. (7.19) can be written as
d ln P ¢H m
solid–gas or liq.–gas equilib. not near T (7.20)
d11>T2 R c
The quantity H H H (or H H ) depends on the temperature
m m,gas m,liq m,gas m,solid
of the phase transition. Once T of the transition is specified, the transition pressure is
fixed, so P is not an independent variable along the equilibrium line. From (7.20), a
plot of ln P versus 1/T has slope H /R at temperature T, and measurement of this
m,T
slope at various temperatures allows H of vaporization or sublimation to be found
m
at each temperature. If the temperature interval is not large and if we are not near T ,
c
H will vary only slightly and the plot will be nearly linear (Fig. 7.6). Strictly speak-
m
ing, we cannot take the log of a quantity with units. To get around this, note that
†
†
d ln P d ln (P/P ), where P is any convenient fixed pressure such as 1 torr, 1 bar,
†
or 1 atm; we thus plot ln (P/P ) versus 1/T.
If we make a third approximation and take H to be constant along the equilib-
m
rium line, integration of (7.19) gives
2 d ln P ¢H 2 1 dT
m
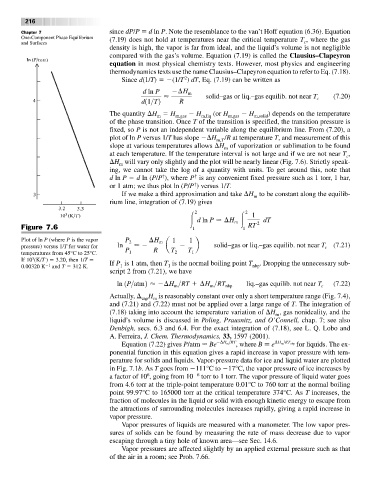
Figure 7.6 1 1 RT 2
Plot of ln P (where P is the vapor P 2 ¢H m 1 1
pressure) versus 1/T for water for ln P R a T T b solid–gas or liq.–gas equilib. not near T c (7.21)
temperatures from 45°C to 25°C. 1 2 1
If 10 (K/T ) 3.20, then 1/T If P is 1 atm, then T is the normal boiling point T . Dropping the unnecessary sub-
3
0.00320 K 1 and T 312 K. 1 1 nbp
script 2 from (7.21), we have
ln 1P>atm2 ¢H >RT ¢H >RT liq.–gas equilib. not near T c (7.22)
m
nbp
m
Actually, H is reasonably constant over only a short temperature range (Fig. 7.4),
vap m
and (7.21) and (7.22) must not be applied over a large range of T. The integration of
(7.18) taking into account the temperature variation of H , gas nonideality, and the
m
liquid’s volume is discussed in Poling, Prausnitz, and O’Connell, chap. 7; see also
Denbigh, secs. 6.3 and 6.4. For the exact integration of (7.18), see L. Q. Lobo and
A. Ferreira, J. Chem. Thermodynamics, 33, 1597 (2001).
Equation (7.22) gives P/atm Be ¢H m >RT , where B e ¢H m >RT nbp for liquids. The ex-
ponential function in this equation gives a rapid increase in vapor pressure with tem-
perature for solids and liquids. Vapor-pressure data for ice and liquid water are plotted
in Fig. 7.1b.As T goes from 111°C to 17°C, the vapor pressure of ice increases by
6
afactor of 10 , going from 10 6 torr to 1 torr. The vapor pressure of liquid water goes
from 4.6 torr at the triple-point temperature 0.01°C to 760 torr at the normal boiling
point 99.97°C to 165000 torr at the critical temperature 374°C. As T increases, the
fraction of molecules in the liquid or solid with enough kinetic energy to escape from
the attractions of surrounding molecules increases rapidly, giving a rapid increase in
vapor pressure.
Vapor pressures of liquids are measured with a manometer. The low vapor pres-
sures of solids can be found by measuring the rate of mass decrease due to vapor
escaping through a tiny hole of known area—see Sec. 14.6.
Vapor pressures are affected slightly by an applied external pressure such as that
of the air in a room; see Prob. 7.66.