
Page 241 - Physical Chemistry
P. 241
lev38627_ch07.qxd 3/14/08 12:51 PM Page 222
222
Chapter 7
One-Component Phase Equilibrium
and Surfaces
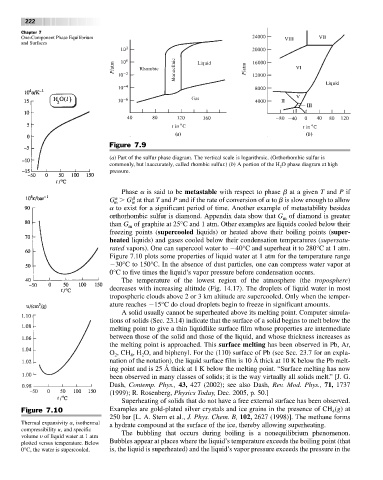
Figure 7.9
(a) Part of the sulfur phase diagram. The vertical scale is logarithmic. (Orthorhombic sulfur is
commonly, but inaccurately, called rhombic sulfur.) (b) A portion of the H O phase diagram at high
2
pressure.
Phase a is said to be metastable with respect to phase b at a given T and P if
b
a
G G at that T and P and if the rate of conversion of a to b is slow enough to allow
m
m
a to exist for a significant period of time. Another example of metastability besides
orthorhombic sulfur is diamond. Appendix data show that G of diamond is greater
m
than G of graphite at 25°C and 1 atm. Other examples are liquids cooled below their
m
freezing points (supercooled liquids) or heated above their boiling points (super-
heated liquids) and gases cooled below their condensation temperatures (supersatu-
rated vapors). One can supercool water to 40°C and superheat it to 280°C at 1 atm.
Figure 7.10 plots some properties of liquid water at 1 atm for the temperature range
30°C to 150°C. In the absence of dust particles, one can compress water vapor at
0°C to five times the liquid’s vapor pressure before condensation occurs.
The temperature of the lowest region of the atmosphere (the troposphere)
decreases with increasing altitude (Fig. 14.17). The droplets of liquid water in most
tropospheric clouds above 2 or 3 km altitude are supercooled. Only when the temper-
ature reaches 15°C do cloud droplets begin to freeze in significant amounts.
A solid usually cannot be superheated above its melting point. Computer simula-
tions of solids (Sec. 23.14) indicate that the surface of a solid begins to melt below the
melting point to give a thin liquidlike surface film whose properties are intermediate
between those of the solid and those of the liquid, and whose thickness increases as
the melting point is approached. This surface melting has been observed in Pb, Ar,
O , CH , H O, and biphenyl. For the (110) surface of Pb (see Sec. 23.7 for an expla-
2
2
4
nation of the notation), the liquid surface film is 10 Å thick at 10 K below the Pb melt-
ing point and is 25 Å thick at 1 K below the melting point. “Surface melting has now
been observed in many classes of solids; it is the way virtually all solids melt.” [J. G.
Dash, Contemp. Phys., 43, 427 (2002); see also Dash, Rev. Mod. Phys., 71, 1737
(1999); R. Rosenberg, Physics Today, Dec. 2005, p. 50.]
Superheating of solids that do not have a free external surface has been observed.
Figure 7.10 Examples are gold-plated silver crystals and ice grains in the presence of CH (g) at
4
250 bar [L. A. Stern et al., J. Phys. Chem. B, 102, 2627 (1998)]. The methane forms
Thermal expansivity a, isothermal a hydrate compound at the surface of the ice, thereby allowing superheating.
compressibility k, and specific
volume y of liquid water at 1 atm The bubbling that occurs during boiling is a nonequilibrium phenomenon.
plotted versus temperature. Below Bubbles appear at places where the liquid’s temperature exceeds the boiling point (that
0°C, the water is supercooled. is, the liquid is superheated) and the liquid’s vapor pressure exceeds the pressure in the