
Page 246 - Physical Chemistry
P. 246
lev38627_ch07.qxd 3/14/08 12:51 PM Page 227
227
Note that the effects of a lambda transition occur over a range of temperatures. Section 7.7
(In b-brass, significant excess heat capacity is observed from about 450 K to about The Interphase Region
850 K. Many other lambda transitions show effects over much shorter temperature
ranges.) At any time during the course of the lambda transition, only one phase is pre- F N edge
sent. The nature of this phase changes in a continuous manner as T is increased. In surf 10 100
contrast, the effects of a first-order phase transition occur at a single temperature, and 1.0
during the transition, two phases (with different structures, different V values, and 0.8
m
different H values) are present.
m
0.6
0.4
7.6 SURFACES AND NANOPARTICLES
0.2
Molecules at the surface of a phase are in a different environment than those in the in-
terior of the phase, and we now consider surface effects. Surface effects are of tremen- 0
dous industrial and biological significance. Many reactions occur most readily on the 10 100 1000 10 4 10 5 10 6
surfaces of catalysts and heterogeneous catalysis is used to synthesize many industrial N
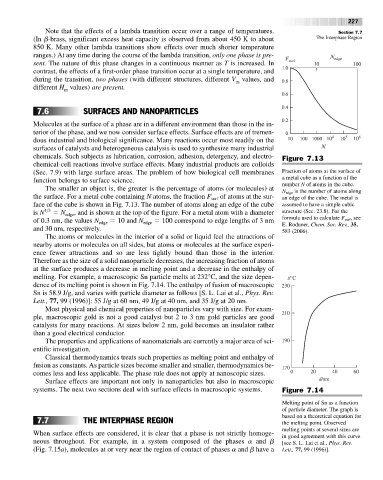
chemicals. Such subjects as lubrication, corrosion, adhesion, detergency, and electro- Figure 7.13
chemical-cell reactions involve surface effects. Many industrial products are colloids
(Sec. 7.9) with large surface areas. The problem of how biological cell membranes Fraction of atoms at the surface of
function belongs to surface science. a metal cube as a function of the
number N of atoms in the cube.
The smaller an object is, the greater is the percentage of atoms (or molecules) at
N edge is the number of atoms along
the surface. For a metal cube containing N atoms, the fraction F surf of atoms at the sur- an edge of the cube. The metal is
face of the cube is shown in Fig. 7.13. The number of atoms along an edge of the cube assumed to have a simple cubic
is N 1>3 N edge , and is shown at the top of the figure. For a metal atom with a diameter structure (Sec. 23.8). For the
of 0.3 nm, the values N edge 10 and N edge 100 correspond to edge lengths of 3 nm formula used to calculate F surf , see
E. Roduner, Chem. Soc. Rev., 35,
and 30 nm, respectively. 583 (2006).
The atoms or molecules in the interior of a solid or liquid feel the attractions of
nearby atoms or molecules on all sides, but atoms or molecules at the surface experi-
ence fewer attractions and so are less tightly bound than those in the interior.
Therefore as the size of a solid nanoparticle decreases, the increasing fraction of atoms
at the surface produces a decrease in melting point and a decrease in the enthalpy of
melting. For example, a macroscopic Sn particle melts at 232°C, and the size depen- t/°C
dence of its melting point is shown in Fig. 7.14. The enthalpy of fusion of macroscopic 230
Sn is 58.9 J/g, and varies with particle diameter as follows [S. L. Lai et al., Phys. Rev.
Lett., 77, 99 (1996)]: 55 J/g at 60 nm, 49 J/g at 40 nm, and 35 J/g at 20 nm.
Most physical and chemical properties of nanoparticles vary with size. For exam-
ple, macroscopic gold is not a good catalyst but 2 to 3 nm gold particles are good 210
catalysts for many reactions. At sizes below 2 nm, gold becomes an insulator rather
than a good electrical conductor.
The properties and applications of nanomaterials are currently a major area of sci- 190
entific investigation.
Classical thermodynamics treats such properties as melting point and enthalpy of
fusion as constants. As particle sizes become smaller and smaller, thermodynamics be- 170
comes less and less applicable. The phase rule does not apply at nanoscopic sizes. 0 20 40 60
Surface effects are important not only in nanoparticles but also in macroscopic d/nm
systems. The next two sections deal with surface effects in macroscopic systems. Figure 7.14
Melting point of Sn as a function
of particle diameter. The graph is
based on a theoretical equation for
7.7 THE INTERPHASE REGION the melting point. Observed
melting points at several sizes are
When surface effects are considered, it is clear that a phase is not strictly homoge-
in good agreement with this curve
neous throughout. For example, in a system composed of the phases a and b [see S. L. Lai et al., Phys. Rev.
(Fig. 7.15a), molecules at or very near the region of contact of phases a and b have a Lett., 77, 99 (1996)].