
Page 318 - Physical Chemistry
P. 318
lev38627_ch10.qxd 3/14/08 1:07 PM Page 299
299
l
l
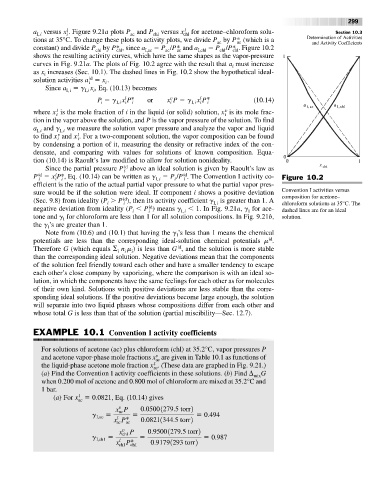
a versus x . Figure 9.21a plots P and P chl versus x chl for acetone–chloroform solu- Section 10.3
ac
I,i
i
tions at 35°C. To change these plots to activity plots, we divide P by P* (which is a Determination of Activities
ac
ac
and Activity Coefficients
constant) and divide P chl by P* , since a I,ac P /P* and a I,chl P /P* . Figure 10.2
ac
chl
ac
chl
chl
shows the resulting activity curves, which have the same shapes as the vapor-pressure
curves in Fig. 9.21a. The plots of Fig. 10.2 agree with the result that a must increase
i
as x increases (Sec. 10.1). The dashed lines in Fig. 10.2 show the hypothetical ideal-
i
id
solution activities a x .
i
i
Since a g x , Eq. (10.13) becomes
I,i i
I,i
l
P g x P* or x P g x P* i (10.14)
v
l
I,i i
I,i i
i
i
i
v
l
where x is the mole fraction of i in the liquid (or solid) solution, x is its mole frac-
i
i
tion in the vapor above the solution, and P is the vapor pressure of the solution. To find
a and g we measure the solution vapor pressure and analyze the vapor and liquid
I,i
I,i
v
l
to find x and x . For a two-component solution, the vapor composition can be found
i
i
by condensing a portion of it, measuring the density or refractive index of the con-
densate, and comparing with values for solutions of known composition. Equa-
tion (10.14) is Raoult’s law modified to allow for solution nonideality.
id
Since the partial pressure P above an ideal solution is given by Raoult’s law as
i
id
id
l
P x P*, Eq. (10.14) can be written as g P /P . The Convention I activity co- Figure 10.2
I,i
i
i
i
i
i
efficient is the ratio of the actual partial vapor pressure to what the partial vapor pres-
sure would be if the solution were ideal. If component i shows a positive deviation Convention I activities versus
id
(Sec. 9.8) from ideality (P P ), then its activity coefficient g is greater than 1. A composition for acetone–
i
I,i
i
chloroform solutions at 35°C. The
id
negative deviation from ideality (P P ) means g 1. In Fig. 9.21a, g for ace- dashed lines are for an ideal
I,i
I
i
i
tone and g for chloroform are less than 1 for all solution compositions. In Fig. 9.21b, solution.
I
the g ’s are greater than 1.
I
Note from (10.6) and (10.1) that having the g ’s less than 1 means the chemical
I
id
potentials are less than the corresponding ideal-solution chemical potentials m .
id
Therefore G (which equals n m ) is less than G , and the solution is more stable
i
i
i
than the corresponding ideal solution. Negative deviations mean that the components
of the solution feel friendly toward each other and have a smaller tendency to escape
each other’s close company by vaporizing, where the comparison is with an ideal so-
lution, in which the components have the same feelings for each other as for molecules
of their own kind. Solutions with positive deviations are less stable than the corre-
sponding ideal solutions. If the positive deviations become large enough, the solution
will separate into two liquid phases whose compositions differ from each other and
whose total G is less than that of the solution (partial miscibility—Sec. 12.7).
EXAMPLE 10.1 Convention I activity coefficients
For solutions of acetone (ac) plus chloroform (chl) at 35.2°C, vapor pressures P
v
and acetone vapor-phase mole fractions x are given in Table 10.1 as functions of
ac
l
the liquid-phase acetone mole fraction x . (These data are graphed in Fig. 9.21.)
ac
(a) Find the Convention I activity coefficients in these solutions. (b) Find mix G
when 0.200 mol of acetone and 0.800 mol of chloroform are mixed at 35.2°C and
1 bar.
l
(a) For x 0.0821, Eq. (10.14) gives
ac
v
x P 0.05001279.5 torr2
ac
g I,ac 0.494
l
x P* 0.08211344.5 torr2
ac ac
x v ch1 P 0.95001279.5 torr2
g I,ch1 0.987
l
x P* 0.91791293 torr2
ch1
ch1