Page 319 - Physical Chemistry
P. 319

lev38627_ch10.qxd  3/14/08  1:07 PM  Page 300


                300
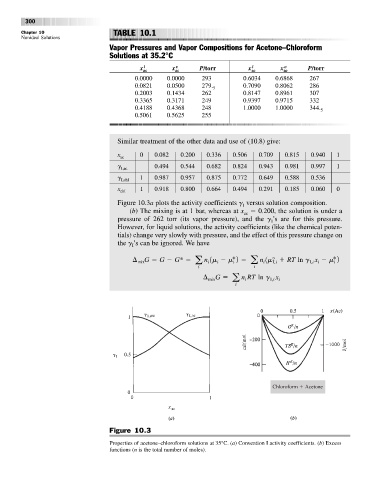
               Chapter 10                 TABLE 10.1
               Nonideal Solutions
                                         Vapor Pressures and Vapor Compositions for Acetone–Chloroform
                                         Solutions at 35.2°C

                                                             v
                                                   l
                                                                                             v
                                                                                    l
                                                  x ac      x ac    P/torr         x ac     x ac     P/torr
                                                 0.0000   0.0000     293         0.6034    0.6868    267
                                                 0.0821   0.0500     279. 5      0.7090    0.8062    286
                                                 0.2003   0.1434     262         0.8147    0.8961    307
                                                 0.3365   0.3171     249         0.9397    0.9715    332
                                                 0.4188   0.4368     248         1.0000    1.0000    344. 5
                                                 0.5061   0.5625     255

                                            Similar treatment of the other data and use of (10.8) give:

                                            x     0    0.082  0.200   0.336   0.506   0.709   0.815  0.940   1
                                            ac
                                            g          0.494  0.544   0.682   0.824   0.943   0.981  0.997   1
                                             I,ac
                                            g     1    0.987  0.957   0.875   0.772   0.649   0.588  0.536
                                             I,chl
                                            x     1    0.918  0.800   0.664   0.494   0.291   0.185  0.060   0
                                            chl
                                            Figure 10.3a plots the activity coefficients g versus solution composition.
                                                                                 I
                                               (b) The mixing is at 1 bar, whereas at x   0.200, the solution is under a
                                                                                 ac
                                            pressure of 262 torr (its vapor pressure), and the  g ’s  are for this pressure.
                                                                                          I
                                            However, for liquid solutions, the activity coefficients (like the chemical poten-
                                            tials) change very slowly with pressure, and the effect of this pressure change on
                                            the g ’s can be ignored. We have
                                                I
                                                ¢  mix G   G   G*    a  n 1m   m*2    a  n 1m°   RT  ln  g x   m*2
                                                                              i
                                                                                       i
                                                                                                     I,i i
                                                                                                            i
                                                                                          I,i
                                                                         i
                                                                       i
                                                                    i               i
                                                                     ¢  mix G    a  n RT  ln  g x
                                                                                  i
                                                                                         I,i i
                                                                               i


                                                                                          Chloroform   Acetone


                                         Figure 10.3

                                         Properties of acetone–chloroform solutions at 35°C. (a) Convention I activity coefficients. (b) Excess
                                         functions (n is the total number of moles).
   314   315   316   317   318   319   320   321   322   323   324