
Page 176 - Pipeline Pigging Technology
P. 176
Inspection of the Forties sea line
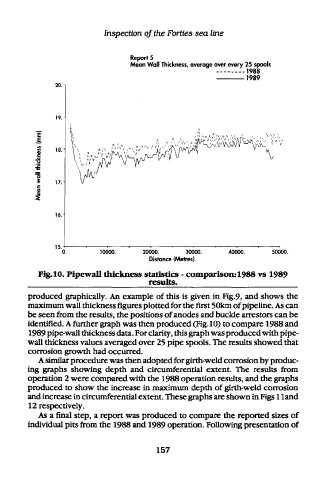
Fig. 10. Pipewall thickness statistics - comparison: 1988 vs 1989
results.
produced graphically. An example of this is given in Fig.9, and shows the
maximum wall thickness figures plotted for the first 50km of pipeline. As can
be seen from the results, the positions of anodes and buckle arresters can be
identified. A further graph was then produced (Fig. 10) to compare 1988 and
1989 pipe-wall thickness data. For clarity, this graph was produced with pipe-
wall thickness values averaged over 25 pipe spools. The results showed that
corrosion growth had occurred.
A similar procedure was then adopted for girth-weld corrosion by produc-
ing graphs showing depth and circumferential extent. The results from
operation 2 were compared with the 1988 operation results, and the graphs
produced to show the increase in maximum depth of girth-weld corrosion
and increase in circumferential extent. These graphs are shown in Figs 1 land
12 respectively.
As a final step, a report was produced to compare the reported sizes of
individual pits from the 1988 and 1989 operation. Following presentation of
157