
Page 279 - Pipeline Pigging Technology
P. 279
Pipeline Pigging Technology
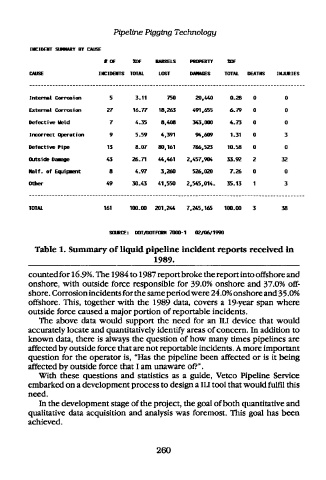
Internal Carogim 5 3.11 750 20.m 0-ts 0 0
External Cormsim 27 16.77 18.a63 491.655 6-7V 0 0
Defectirre Yeld 7 4.35 8.a =.mo 4.73 0 0
lnorrect @erarim 9 5.59 4,3p1 %.- 1.31 0 3
Defective Pipe 13 8-07 80,161 746,523 10.58 0 0
Outside D- 43 26.n 44,461 2,457,- 33.92 2 32
half. of Ecpipent 8 4-97 3.260 526.020 7.26 0 0
other 49 30.43 41,550 2,545,014- S.13 1 3
TOTAL 161 1m-m 201.244 7.24s.it~i 1m.w 3 38
Table 1. Summary of licpid pipeline incident reports received in
1989.
countedfor 16.9%. The 1984 to 1987 report broke the report into offshore and
onshore, with outside force responsible for 39.0% onshore and 37.0% off-
shore. Corrosion incidentsfor the same periodwere 24.0% onshore and 35.0%
offshore. This, together with the 1989 data, covers a 19-year span where
outside force caused a major portion of reportable incidents.
The above data would support the need for an ILI device that would
accurately locate and quantitatively identify areas of concern. In addition to
known data, there is always the question of how many times pipelines are
affected by outside force that are not reportable incidents. A more important
question for the operator is, "Has the pipeline been affected or is it being
affected by outside force that I am unaware of?".
With these questions and statistics as a guide, Vetco Pipeline Service
embarked on a development process to design a ILI tool that would fulfil this
need.
In the development stage of the project, the goal of both quantitative and
qualitative data acquisition and analysis was foremost. This goal has been
achieved.
260