
Page 280 - Pipeline Pigging Technology
P. 280
Pigging for pipeline integrity analysis
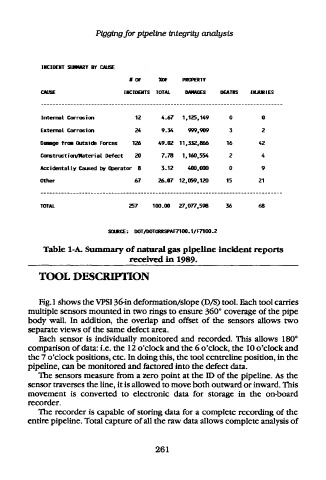
INCIDENT SUMMARY BY CAUSE
# OF XOF PROPERTY
CAUSE INCIDENTS TOTAL DAMAGES DEATHS INJURIES
Internal Corrosion 12 4.67 1.125.149 0 0
External Corrosion 24 9.34 999.909 3 2
Damage fro» Outside Forces 126 49.02 11.332.866 16 42
Construction/Material Defect 20 7.78 1.160.554 2 4
Accidentally Caused by Operator 8 3.12 400.000 0 9
Other 67 26.07 12.059.120 15 21
TOTAL 257 100.00 27.077.598 36 68
SOURCE: DOT/DOTORRSPAF7100.1/F7100.2
Table 1-A. Summary of natural gas pipeline incident reports
received in 1989.
TOOL DESCRIPTION
Fig.l shows the VPSI 36-in deformation/slope (D/S) tool. Each tool carries
multiple sensors mounted in two rings to ensure 360° coverage of the pipe
body wall. In addition, the overlap and offset of the sensors allows two
separate views of the same defect area.
Each sensor is individually monitored and recorded. This allows 180°
comparison of data: i.e. the 12 o'clock and the 6 o'clock, the 10 o'clock and
the 7 o'clock positions, etc. In doing this, the tool centreline position, in the
pipeline, can be monitored and factored into the defect data.
The sensors measure from a zero point at the LD of the pipeline. As the
sensor traverses the line, it is allowed to move both outward or inward. This
movement is converted to electronic data for storage in the on-board
recorder.
The recorder is capable of storing data for a complete recording of the
entire pipeline. Total capture of all the raw data allows complete analysis of
261