
Page 359 - Pipeline Pigging Technology
P. 359
Pipeline Pigging Technology
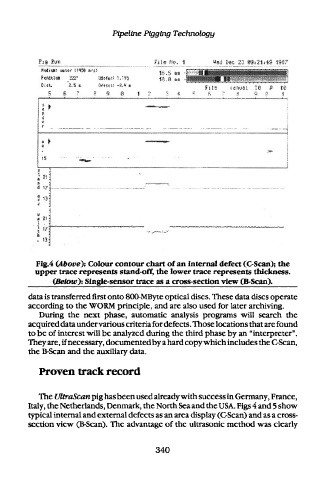
Fig.4 (Above): Colour contour chart of an internal defect (C-Scan); the
upper trace represents stand-off, the lower trace represents thickness.
(Below): Single-sensor trace as a cross-section view (B-Scan).
data is transferred first onto 800-MByte optical discs. These data discs operate
according to the WORM principle, and are also used for later archiving.
During the next phase, automatic analysis programs will search the
acquired data under various criteria for defects. Those locations that are found
to be of interest will be analyzed during the third phase by an "interpreter".
They are, if necessary, documented by a hard copy which includes the C-Scan,
the B-Scan and the auxiliary data.
Proven track record
The UltraScan pig has been used already with success in Germany, France,
Italy, the Netherlands, Denmark, the North Sea and the USA. Figs 4 and 5 show
typical internal and external defects as an area display (C-Scan) and as a cross-
section view (B-Scan). The advantage of the ultrasonic method was clearly
340