
Page 415 - Pipeline Pigging Technology
P. 415
Pipeline Pigging Technology
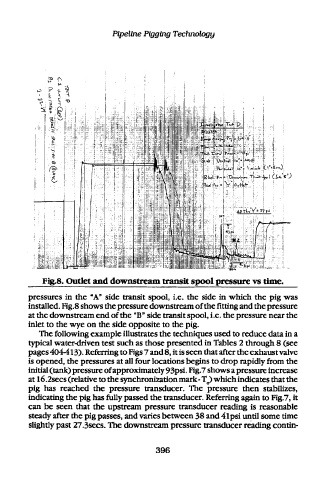
Fig.8. Outlet and downstream transit spool pressure vs time.
pressures in the "A" side transit spool, i.e. the side in which the pig was
installed. Fig.8 shows the pressure downstream of the fitting and the pressure
at the downstream end of the "B" side transit spool, i.e. the pressure near the
inlet to the wye on the side opposite to the pig.
The following example illustrates the techniques used to reduce data in a
typical water-driven test such as those presented in Tables 2 through 8 (see
pages 404-413). Referring to Figs 7 and 8, it is seen that after the exhaust valve
is opened, the pressures at all four locations begins to drop rapidly from the
initial (tank) pressure of approximately 93psi. Fig.7 shows a pressure increase
at I6.2secs (relative to the synchronization mark - T^) which indicates that the
pig has reached the pressure transducer. The pressure then stabilizes,
indicating the pig has fully passed the transducer. Referring again to Fig.7, it
can be seen that the upstream pressure transducer reading is reasonable
steady after the pig passes, and varies between 38 and 4lpsi until some time
slightly past 27.3secs. The downstream pressure transducer reading contin-
396