
Page 131 - Pipeline Risk Management Manual Ideas, Techniques, and Resources
P. 131
5/108 Design index
instruments, the recording instruments, a power supply, and Identification and reporting of immediate threats to pipeline
cups used for propulsion of the pig. integrity
After receiving an ILI indication of an anomaly, an excava- Overall report content and analysis such as corrosion type,
tion is usually required to more accurately inspect the pipe- defect type, and minimum defect criteria
using visual and NDT techniques (see Appendix G)-and Performance specifications and variance approval processes
make repairs. Sample excavating to inspect the pipe is also used Vendor personnel qualifications.
to validate the ILI results. The process of selecting appropriate
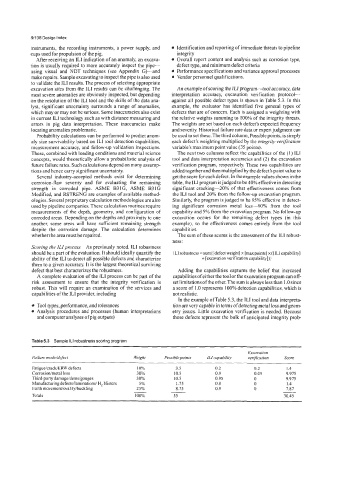
excavation sites from the ILI results can be challenging. The An example of scoring the ILI program-tool accuracy, data
most severe anomalies are obviously inspected, but depending interpretation accuracy, excavation verification protocol-
on the resolution of the ILI tool and the skills of the data ana- against all possible defect types is shown in Table 5.3. In this
lyst, significant uncertainty surrounds a range of anomalies, example, the evaluator has identified five general types of
which may or may not be serious. Some inaccuracies also exist defects that are of concern. Each is assigned a weighting with
in current ILI technology such as with distance measuring and the relative weights summing to 100% of the integrity threats.
errors in pig data interpretation. These inaccuracies make The weights are set based on each defect’s expected frequency
locating anomalies problematic. and severity. Historical failure rate data or expert judgment can
Probability calculations can be performed to predict anom- be used to set these. The third column, Possiblepoints, is simply
aly size survivability based on ILI tool detection capabilities, each defect’s weighting multiplied by the integrity verification
measurement accuracy, and follow-up validation inspections. variable’s maximum point value (35 points).
These, combined with loading conditions and material science The next two columns reflect the capabilities of the (I) ILI
concepts, would theoretically allow a probabilistic analysis of tool and data interpretation accuracies and (2) the excavation
future failure rates. Such calculations depend on many assump- verification program, respectively. These two capabilities are
tions and hence carry significant uncertainty. added together and then multiplied by the defect’s point value to
Several industry-accepted methods exist for determining get the score for each defect. In the example values shown in the
corrosion-flaw severity and for evaluating the remaining table, the ILI program isjudged to be 40% effective in detecting
strength in corroded pipe. ASME B31G, ASME B31G significant cracking-20% of that effectiveness comes from
Modified, and RSTRENG are examples of available method- the ILI tool and 20% from the follow-up excavation program.
ologies. Several proprietary calculation methodologies are also Similarly, the program is judged to be 95% effective in detect-
used by pipeline companies. These calculation routines require ing significant corrosion metal loss-90% from the tool
measurements of the depth, geometry, and configuration of capability and 5% from the excavation program. No follow-up
corroded areas. Depending on the depths and proximity to one excavation occurs for the remaining defect types (in this
another, some areas will have sufficient remaining strength example), so the effectiveness comes entirely from the tool
despite the corrosion damage. The calculation determines capabilities.
whether the area must be repaired. The sum of these scores is the assessment of the ILI robust-
ness:
Scoring the ILIprocess As previously noted ILI robustness
should be a part of the evaluation. It should ideally quantify the ILI robustness = sum{ [defect weight] x [max points] x ([ILI capability]
ability of the ILI to detect all possible defects and characterize + [excavation verification capability])}
them to a given accuracy. It is the largest theoretical surviving
defect that best characterizes the robustness. Adding the capabilities captures the belief that increased
A complete evaluation of the ILI process can be part of the capabilities of either the tool or the excavation program can off-
risk assessment to ensure that the integrity verification is set limitations ofthe other. The sum is always less than 1 .O since
robust. This will require an examination of the services and a score of 1 .O represents 100% detection capabilities, which is
capabilities of the ILI provider, including not realistic.
In the example ofTable 5.3, the ILI tool and data interpreta-
Tool types, performance, and tolerances tion are very capable in terms of detectingmetal loss and geom-
Analysis procedures and processes (human interpretations etry issues. Little excavation verification is needed. Because
and computer analyses ofpig outputs) those defects represent the bulk of anticipated integrity prob-
Table 5.3 Sample ILI robustness scoring program
~~~
Excavation
Failure mode/de/ect Weight Possible points ILI capabilih, verification Score
FatiguelcracWERW defects 10% 3.5 0.2 0.2 I .4
Corrosionlmetal loss 30% 10.5 0.9 0.05 9.975
Third-party damage/dents/gouges 30% 10.5 0.95 0 9.975
Manufacturing defectsllaminationsi H, blisters 5 Y” 1.75 0.8 0 1.4
Earth movement/ovalityibuckling - - 0.9 0 -
7.87
25%
8.75
Totals 100% 35 30.45