
Page 247 - Pipeline Rules of Thumb Handbook
P. 247
234 Pipeline Rules of Thumb Handbook
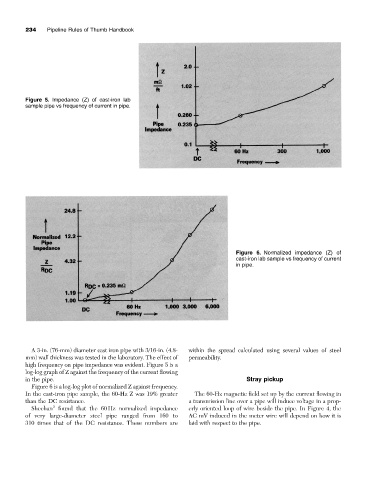
Figure 5. Impedance (Z) of cast-iron lab
sample pipe vs frequency of current in pipe.
Figure 6. Normalized impedance (Z) of
cast-iron lab sample vs frequency of current
in pipe.
A 3-in. (76-mm) diameter cast iron pipe with 3/16-in. (4.8- within the spread calculated using several values of steel
mm) wall thickness was tested in the laboratory. The effect of permeability.
high frequency on pipe impedance was evident. Figure 5 is a
log-log graph of Z against the frequency of the current flowing
in the pipe. Stray pickup
Figure 6 is a log-log plot of normalized Z against frequency.
In the cast-iron pipe sample, the 60-Hz Z was 19% greater The 60-Hz magnetic field set up by the current flowing in
than the DC resistance. a transmission line over a pipe will induce voltage in a prop-
3
Sheehan found that the 60Hz normalized impedance erly oriented loop of wire beside the pipe. In Figure 4, the
of very large-diameter steel pipe ranged from 160 to AC mV induced in the meter wire will depend on how it is
310 times that of the DC resistance. These numbers are laid with respect to the pipe.