
Page 245 - Pipeline Rules of Thumb Handbook
P. 245
232 Pipeline Rules of Thumb Handbook
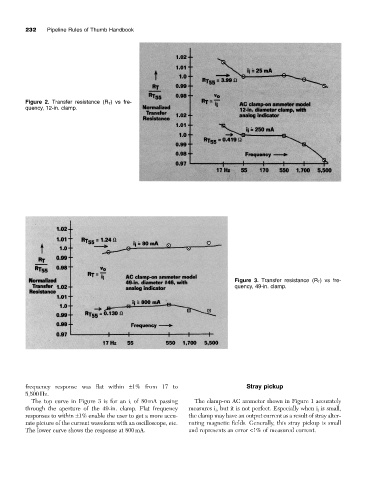
Figure 2. Transfer resistance (R T ) vs fre-
quency, 12-in. clamp.
Figure 3. Transfer resistance (R T ) vs fre-
quency, 49-in. clamp.
frequency response was flat within ±1% from 17 to Stray pickup
5,500Hz.
The top curve in Figure 3 is for an i i of 80mA passing The clamp-on AC ammeter shown in Figure 1 accurately
through the aperture of the 49-in. clamp. Flat frequency measures i i , but it is not perfect. Especially when i i is small,
responses to within ±1% enable the user to get a more accu- the clamp may have an output current as a result of stray alter-
rate picture of the current waveform with an oscilloscope, etc. nating magnetic fields. Generally, this stray pickup is small
The lower curve shows the response at 800mA. and represents an error <1% of measured current.