
Page 255 - Pipeline Rules of Thumb Handbook
P. 255
242 Pipeline Rules of Thumb Handbook
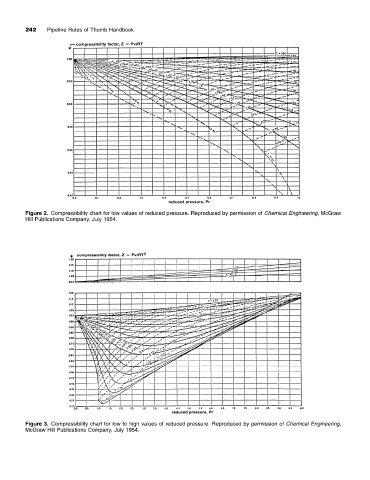
Figure 2. Compressibility chart for low values of reduced pressure. Reproduced by permission of Chemical Engineering, McGraw
Hill Publications Company, July 1954.
Figure 3. Compressibility chart for low to high values of reduced pressure. Reproduced by permission of Chemical Engineering,
McGraw Hill Publications Company, July 1954.