
Page 256 - Pipeline Rules of Thumb Handbook
P. 256
Gas—General 243
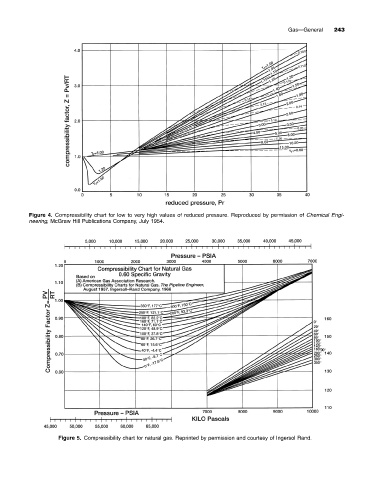
Figure 4. Compressibility chart for low to very high values of reduced pressure. Reproduced by permission of Chemical Engi-
neering, McGraw Hill Publications Company, July 1954.
Figure 5. Compressibility chart for natural gas. Reprinted by permission and courtesy of Ingersol Rand.