
Page 142 - Pipelines and Risers
P. 142
On-bottom Stabilify 115
The structural behavior of pipeline along its route can be analyzed using finite-element
simulations of the load history from installation, flooding, hydro test, de-watering to
operation. This analysis makes it possible to simulate the pipeline in-place behavior. Based on
the understanding of the pipeline behavior from the analysis it is possible to select a seabed
intervention design that is technically feasible and cost effective. The effect of the
intervention can then be analyzed in detail for each particular location of the pipeline by
finite-element simulations. The finite-element simulations are therefore a great toolhelp for
developing a rational intervention strategy.
This kind of simulations has also shown that the results can be quite sensitive to the shape and
properties of the seabed. As a result of this the actual behavior of the pipeline can differ from
the simulated behavior. Some factors that affect this is:
- Deviations between the planned route and the as-laid route.
- Actual lay tension during installation.
- Performance of seabed intervention, primarily trenching.
- Local variations in soil conditions.
It is therefore suggested to take the final decision on whether to perform seabed intervention
work at some locations when as-built information becomes available.
8.5.3 Effect of Seabed Intervention
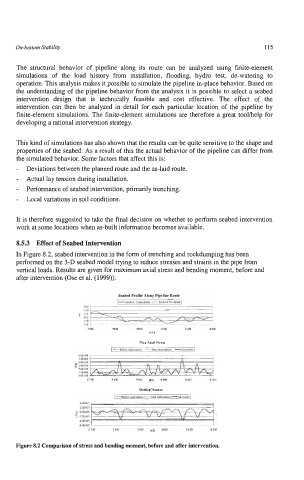
In Figure 8.2, seabed intervention in the form of trenching and rockdumping has been
performed on the 3-D seabed model trying to reduce stresses and strains in the pipe from
vertical loads. Results are given for maximum axial stress and bending moment, before and
after intervention (Ose et al. (1999)).
Seabed ProKle Along Pipeline Route
-309 , -S~ubcd.Umd&i ..... SubcdModdrd
_.I
8 -311
- -312
-313
-314
57M 5800 J9M 6wo 61W 6200
IKPI
Max Axial Shes
I 700 18w J9w IWI 6030 6 IM 6 2M
BarfiltgMrmpn
.~
5m 5800 59(0 IKP] 6m3 6 IW 6203
Figure 8.2 Comparison of stress and bending moment, before and after intervention.