
Page 295 - Pipelines and Risers
P. 295
268 Chapter i5
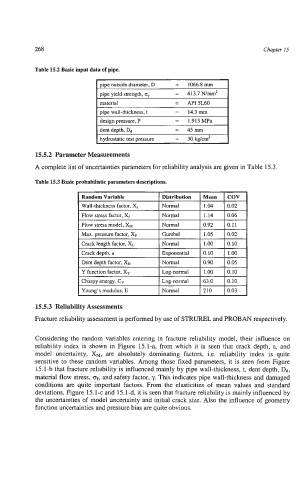
Table 15.2 Basic input data of pipe.
Dioe outside diameter. D = 1066.8 mm I
pipe yield strength, oy = 413.7N/m2
material = API5L60
pipe wall-thickness, t = 14.3 mm
design uressure, P = 1.913MPa
dent depth, Dd = 45mm
hydrostatic test pressure = 30kg/cm2
15.5.2 Parameter Measurements
A complete list of uncertainties parameters for reliability analysis are given in Table 15.3.
Table 15.3 Basic probabilistic parameters descriptions.
Distribution Mean COV
I Wall-thickness factor, X,
I FIOW stress factor, X, I Normal I 1.14 10.06 I
Flow stress model, XH Normal 0.92 0.11
Max. pressure factor, X, Gumbel 1.05 0.02
Crack length factor, X, Normal 1.00 0.10
Crack depth, a Exponential 0.10 1.00
Dent depth factor, XD Normal 0.90 0.05
Y function factor, Xu Log-normal 1.00 0.10
Choy energy, CV Log-normal 63.0 0.10
Young’s modulus, E Normal 210 0.03
Considering the random variables entering in fracture reliability model, their influence on
reliability index is shown in Figure 15.1-a, from which it is seen that crack depth, a, and
model uncertainty, XM, are absolutely dominating factors, Le. reliability index is quite
sensitive to these random variables. Among those fixed parameters, it is seen from Figure
15.1-b that fracture reliability is influenced mainly by pipe wall-thickness, t, dent depth, Dd,
material flow stress, of, and safety factor, y. This indicates pipe wall-thickness and damaged
conditions are quite important factors. From the elasticities of mean values and standard
deviations, Figure 15.1-c and 15.1-d, it is seen that fracture reliability is mainly influenced by
the uncertainties of model uncertainty and initial crack size. Also the influence of geometry
function uncertainties and pressure bias are quite obvious.