
Page 313 - Pipelines and Risers
P. 313
286 Chapter I6
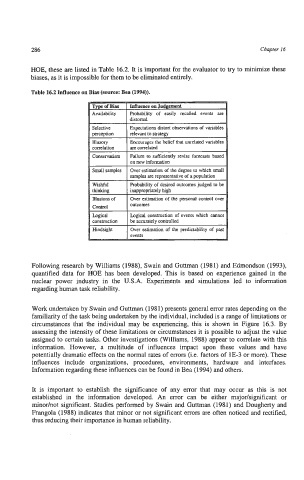
HOE, these are listed in Table 16.2. It is important for the evaluator to try to minimize these
biases, as it is impossible for them to be eliminated entirely.
Table 16.2 Influence on Bias (source: Bea (1994)).
Availability Probability of easily recalled events are
distorted
Selective Expectations distort observations of variables
Derceotion relevant to strateev
1 Illusory 1 Encourages the belief that unrelated variables 11
correlation I are correlated
ll Conservatism 1 Failure to sufficiently revise forecasts based
n I onnewinformation II
Small samples Over estimation of the degree to which small
samples are representative of a population
Wishful Probability of desired outcomes judged to be
thinking inauurooriatelv high
Illusions of Over estimation of the personal control over
Control outcomes
Logical Logical construction of events which cannot
construction be accurately controlled
Hindsight Over estimation of the predictability of past
events
Following research by Williams (1988), Swain and Guttman (1981) and Edmondson (1993),
quantified data for HOE has been developed. This is based on experience gained in the
nuclear power industry in the U.S.A. Experiments and simulations led to information
regarding human task reliability.
Work undertaken by Swain and Guttman (1981) presents general error rates depending on the
familiarity of the task being undertaken by the individual, included is a range of limitations or
circumstances that the individual may be experiencing, this is shown in Figure 16.3. By
assessing the intensity of these limitations or circumstances it is possible to adjust the value
assigned to certain tasks. Other investigations (Williams, 1988) appear to correlate with this
information. However, a multitude of influences impact upon these values and have
potentially dramatic effects on the normal rates of errors (i.e. factors of 1E-3 or more). These
influences include organizations, procedures, environments, hardware and interfaces.
Information regarding these influences can be found in Bea (1994) and others.
It is important to establish the significance of any error that may occur as this is not
established in the information developed. An error can be either rnajorkignificant or
minorhot significant. Studies performed by Swain and Guttman (1981) and Dougherty and
Frangola (1988) indicates that minor or not significant errors are often noticed and rectified,
thus reducing their importance in human reliability.