
Page 280 - Planning and Design of Airports
P. 280
Geometric Design of the Airfield 241
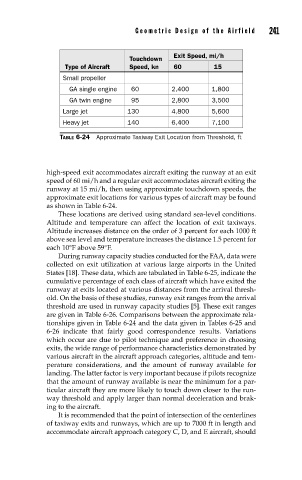
Exit Speed, mi/h
Touchdown
Type of Aircraft Speed, kn 60 15
Small propeller
GA single engine 60 2,400 1,800
GA twin engine 95 2,800 3,500
Large jet 130 4,800 5,600
Heavy jet 140 6,400 7,100
TABLE 6-24 Approximate Taxiway Exit Location from Threshold, ft
high-speed exit accommodates aircraft exiting the runway at an exit
speed of 60 mi/h and a regular exit accommodates aircraft exiting the
runway at 15 mi/h, then using approximate touchdown speeds, the
approximate exit locations for various types of aircraft may be found
as shown in Table 6-24.
These locations are derived using standard sea-level conditions.
Altitude and temperature can affect the location of exit taxiways.
Altitude increases distance on the order of 3 percent for each 1000 ft
above sea level and temperature increases the distance 1.5 percent for
each 10°F above 59°F.
During runway capacity studies conducted for the FAA, data were
collected on exit utilization at various large airports in the United
States [18]. These data, which are tabulated in Table 6-25, indicate the
cumulative percentage of each class of aircraft which have exited the
runway at exits located at various distances from the arrival thresh-
old. On the basis of these studies, runway exit ranges from the arrival
threshold are used in runway capacity studies [5]. These exit ranges
are given in Table 6-26. Comparisons between the approximate rela-
tionships given in Table 6-24 and the data given in Tables 6-25 and
6-26 indicate that fairly good correspondence results. Variations
which occur are due to pilot technique and preference in choosing
exits, the wide range of performance characteristics demonstrated by
various aircraft in the aircraft approach categories, altitude and tem-
perature considerations, and the amount of runway available for
landing. The latter factor is very important because if pilots recognize
that the amount of runway available is near the minimum for a par-
ticular aircraft they are more likely to touch down closer to the run-
way threshold and apply larger than normal deceleration and brak-
ing to the aircraft.
It is recommended that the point of intersection of the centerlines
of taxiway exits and runways, which are up to 7000 ft in length and
accommodate aircraft approach category C, D, and E aircraft, should