
Page 124 - Plastics Engineering
P. 124
Mechanical Behaviour of Plastics 107
2.4
2.2
2.0
1.8
1.6
.E 1.2
L
fj 1.0
0.8
0.6
0.4
0.2
n
yo-l 100 101 102 lo3 lo4 io5
Time (hours)
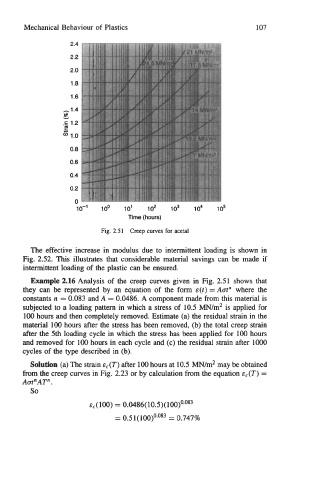
Fig. 2.51 Creep curves for acetal
The effective increase in modulus due to intermittent loading is shown in
Fig. 2.52. This illustrates that considerable material savings can be made if
intermittent loading of the plastic can be ensured.
Example 2.16 Analysis of the creep curves given in Fig. 2.51 shows that
they can be represented by an equation of the form E(t) =Am" where the
constants n = 0.083 and A = 0.0486. A component made from this material is
subjected to a loading pattern in which a stress of 10.5 MN/m2 is applied for
100 hours and then completely removed. Estimate (a) the residual strain in the
material 100 hours after the stress has been removed, (b) the total creep strain
after the 5th loading cycle in which the stress has been applied for 100 hours
and removed for 100 hours in each cycle and (c) the residual strain after lo00
cycles of the type described in (b).
Solution (a) The strain E,(T) after 100 hours at 10.5 MN/m2 may be obtained
from the creep curves in Fig. 2.23 or by calculation from the equation E,(T) =
AatnAT".
so
=
~~(100) 0.0486(10.5)(100)0~083
= 0.51(100)0~083 = 0.747%