
Page 129 - Plastics Engineering
P. 129
112 Mechanical Behaviour of Plastics
El
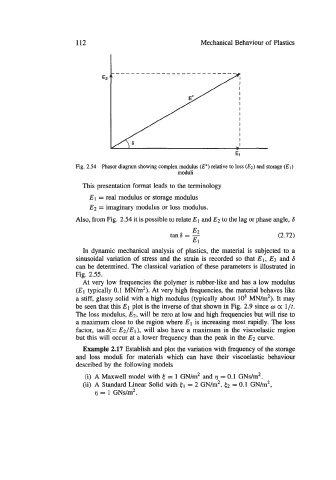
Fig. 2.54 Phasor diagram showing complex modulus (E*) relative to loss (E2) and storage (El)
moduli
This presentation format leads to the terminology
E 1 = real modulus or storage modulus
E2 = imaginary modulus or loss modulus.
Also, from Fig. 2.54 it is possible to relate El and E2 to the lag or phase angle, 6
E2
tans= - (2.72)
El
In dynamic mechanical analysis of plastics, the material is subjected to a
sinusoidal variation of stress and the strain is recorded so that E 1, E2 and 6
can be determined. The classical variation of these parameters is illustrated in
Fig. 2.55.
At very low frequencies the polymer is rubber-like and has a low modulus
(El typically 0.1 MN/m2). At very high frequencies, the material behaves like
a stiff, glassy solid with a high modulus (typically about lo3 MN/m2). It may
be seen that this El plot is the inverse of that shown in Fig. 2.9 since o cx l/t.
The loss modulus, E2, will be zero at low and high frequencies but will rise to
a maximum close to the region where El is increasing most rapidly. The loss
factor, tans(= E2/E1). will also have a maximum in the viscoelastic region
but this will occur at a lower frequency than the peak in the E2 curve.
Example 2.17 Establish and plot the variation with frequency of the storage
and loss moduli for materials which can have their viscoelastic behaviour
described by the following models
(i) A Maxwell model with i$ = 1 GN/m2 and Q = 0.1 GNs/m2.
(ii) A Standard Linear Solid with (1 = 2 GN/m2, (2 = 0.1 GN/m2,
r,~ = 1 GNs/m2.