
Page 134 - Plastics Engineering
P. 134
Mechanical Behaviour of Plastics 117
Modulus
[EITl
IE1T2
t VaT log(time)
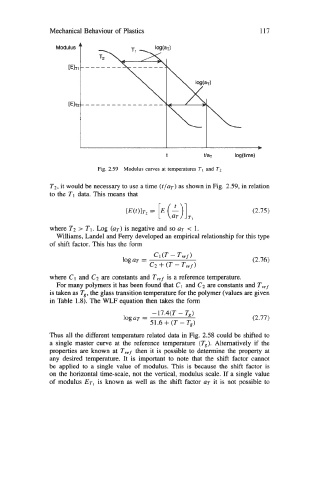
Fig. 2.59 Modulus curves at temperatures TI and T2
T2, it would be necessary to use a time @/aT) as shown in Fig. 2.59, in relation
to the T1 data. This means that
(2.75)
where T2 > TI. Log (UT) is negative and so UT < 1.
Williams, Landel and Feny developed an empirical relationship for this type
of shift factor. This has the form
(2.76)
where C1 and C2 are constants and Tref is a reference temperature.
For many polymers it has been found that C1 and C2 are constants and T,j
is taken as Tgr the glass transition temperature for the polymer (values are given
in Table 1.8). The WLF equation then takes the form
-17.4(T - Tg)
logaT = (2.77)
51.6 + (T - Tg)
Thus all the different temperature related data in Fig. 2.58 could be shifted to
a single master curve at the reference temperature (T,). Alternatively if the
properties are known at T,f then it is possible to determine the property at
any desired temperature. It is important to note that the shift factor cannot
be applied to a single value of modulus. This is because the shift factor is
on the horizontal time-scale, not the vertical, modulus scale. If a single value
of modulus ET^ is known as well as the shift factor UT it is not possible to