
Page 157 - Plastics Engineering
P. 157
140 Mechanical Behaviour of Plastics
processes initiate at these defects and so the development and propagation of a
crack will depend on a series of random events. Since the distribution and size
of the flaws are likely to be quite different, even in outwardly identical samples,
then the breaking strength of the plastic is a function of the probability of a
sufficiently large defect being correctly oriented in a highly stressed region of
the material. Since there is a greater probability of a suitable defect existing in
a large piece of material there may be a size effect. The most important point
to be realised is that the breaking strength of a material is not a unique value
which can be reproduced at will. At best there may be a narrow distribution
of strength values but in all cases it is essential to satisfy oneself about the
statistical significance of a single data point. The design procedures which are
most successful at avoiding fracture usually involve the selection of a factor of
safety which will reduce the probability of failure to an acceptably low value.
2.21.1 Effect of Cyclic Frequency
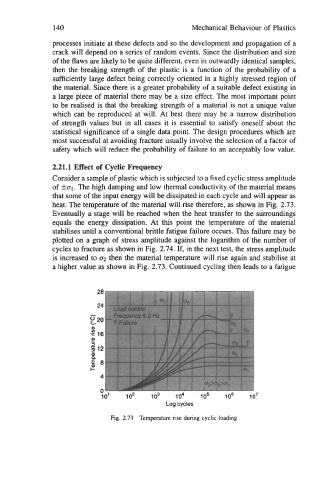
Consider a sample of plastic which is subjected to a fixed cyclic stress amplitude
of fa1 . The high damping and low thermal conductivity of the material means
that some of the input energy will be dissipated in each cycle and will appear as
heat. The temperature of the material will rise therefore, as shown in Fig. 2.73.
Eventually a stage will be reached when the heat transfer to the surroundings
equals the energy dissipation. At this point the temperature of the material
stabilises until a conventional brittle fatigue failure occurs. This failure may be
plotted on a graph of stress amplitude against the logarithm of the number of
cycles to fracture as shown in Fig. 2.74. If, in the next test, the stress amplitude
is increased to 02 then the material temperature will rise again and stabilise at
a higher value as shown in Fig. 2.73. Continued cycling then leads to a fatigue
Fig. 2.73 Temperature rise during cyclic loading