
Page 170 - Practical Design Ships and Floating Structures
P. 170
145
i
I ~- -- ~~ -- ~-
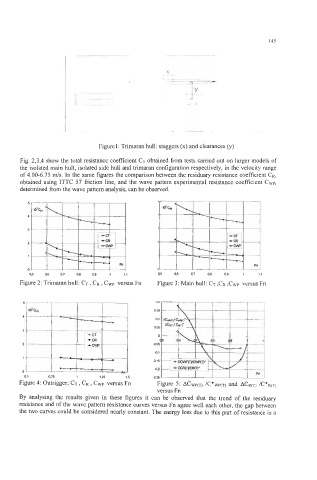
Figurel: Trimaran hull: staggers (x) and clearances (y)
Fig. 2,3,4 show the total resistance coefficient CT obtained from tests carried out on larger models of
the isolated main hull, isolated side hull and trimaran configuration respectively, in the velocity range
of 4.00-6.75 ds. In the same figures the comparison between the residuary resistance coefficient CR,
obtained using ITTC 57 friction line, and the wave pattern experimental resistance coefficient Cwp,
determined from the wave pattern analysis, can be observed.
0.5 0.6 0.7 0.8 0.9 1 1,l 0.5 0.6 0.7 0.8 0.9 1 1.1
Figure 2: Trimaran hull: CT , CR , Cwp versus Fn Figure 3: Main hull: CT ,CR ,Cwp versus Fn
3~ -
i-iF
1
1 +CR
2 -. - I -caw
~~
1 c- -.
04 7 '
0.5 0.75 1.25 1.5
Figure 5: ACWP(T) /C*WP(T) and ACR(T) /C*R(T)
versus Fn
By analysing the results given in these figures it can be observed that the trend of the residuary
resistance and of the wave pattern resistance curves versus Fn agree well each other, the gap between
the two curves could be considered nearly constant. The energy loss due to this part of resistance is a