
Page 488 - Practical Design Ships and Floating Structures
P. 488
463
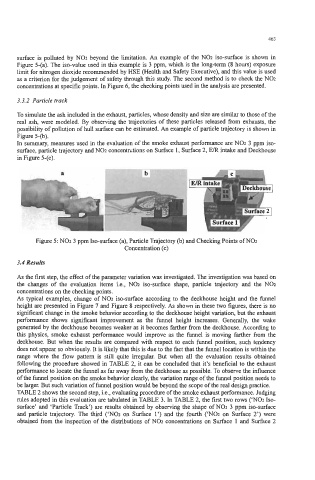
surface is polluted by NO2 beyond the limitation. An example of the NOz iso-surface is shown in
Figure 5-(a). The iso-value used in this example is 3 ppm, which is the long-term (8 hours) exposure
limit for nitrogen dioxide recommended by HSE (Health and Safety Executive), and this value is used
as a criterion for the judgement of safety through this study. The second method is to check the NO2
concentrations at specific points. In Figure 6, the checking points used in the analysis are presented.
3.3.2 Particle track
To simulate the ash included in the exhaust, particles, whose density and size are similar to those of the
real ash, were modeled. By observing the trajectories of these particles released from exhausts, the
possibility of pollution of hull surface can be estimated. An example of particle trajectory is shown in
Figure 5-(b).
In summary, measures used in the evaluation of the smoke exhaust performance are NO2 3 ppm iso-
surface, particle trajectory and NOz concentrztions on Surface 1, Surface 2, E/R intake and Deckhouse
in Figure 5-(c).
Figure 5: NO2 3 ppm Iso-surface (a), Particle Trajectory (b) and Checking Points of NO2
Concentration (c)
3.4 Results
As the first step, the effect of the parameter variation was investigated. The investigation was based on
the changes of the evaluation items i.e., NOz iso-surface shape, particle trajectory and the NO2
concentrations on the checking points.
As typical examples, change of NO2 iso-surface according to the deckhouse height and the funnel
height are presented in Figure 7 and Figure 8 respectively. As shown in these two figures, there is no
significant change in the smoke behavior according to the deckhouse height variation, but the exhaust
performance shows significant improvement as the funnel height increases. Generally, the wake
generated by the deckhouse becomes weaker as it becomes farther from the deckhouse. According to
this physics, smoke exhaust performance would improve as the funnel is moving farther from the
deckhouse. But when the results are compared with respect to each funnel position, such tendency
does not appear so obviously. It is likely that this is due to the fact that the funnel location is within the
range where the flow pattern is still quite irregular. But when all the evaluation results obtained
following the procedure showed in TABLE 2, it can be concluded that it’s beneficial to the exhaust
performance to locate the funnel as far away from the deckhouse as possible. To observe the influence
of the funnel position on the smoke behavior clearly, the variation range of the funnel position needs to
be larger. But such variation of funnel position would be beyond the scope of the real design practice.
TABLE 2 shows the second step, Le., evaluating procedure of the smoke exhaust performance. Judging
rules adopted in this evaluation are tabulated in TABLE 3. In TABLE 2, the first two rows (‘NO2 Iso-
surface’ and ‘Particle Track’) are results obtained by observing the shape of NOz 3 ppm iso-surface
and particle trajectory. The third (‘NOz on Surface 1’) and the fourth (‘NOz on Surface 2’) were
obtained from the inspection of the distributions of NOz concentrations on Surface 1 and Surface 2