
Page 241 - Practical Ship Design
P. 241
Powering II 203
5.0
4.8
4.6
7
g 4.4
X
E
V- 4.2
4.0
3.8
3.6
0.55 0.60 0.65 0.70 0.75 0.80 0.85
Block Coefficient
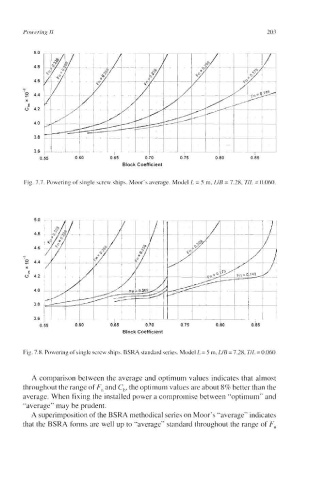
Fig. 7.7. Powering of single screw ships. Moor’s average. Model L = 5 m, UB = 7.28, TIL = 0.060.
5.0
4.8
4.6
0
g 4.4
X
E
V- 4.2
4.0
3.8
3.6
0 .55 0.60 0.65 0.70 0.75 0.80 0.85
Block Coefficient
Fig. 7.8. Powering of single screw ships. BSRA standard series. Model L = 5 m, UB = 7.28, TIL = 0.060.
A comparison between the average and optimum values indicates that almost
throughout the range of F,, and C,, the optimum values are about 8% better than the
average. When fixing the installed power a compromise between “optimum” and
“average” may be prudent.
A superimposition of the BSRA methodical series on Moor’s “average” indicates
that the BSRA forms are well up to “average” standard throughout the range of F,,