
Page 82 - Practical Well Planning and Drilling Manual
P. 82
Section 1 revised 11/00/bc 1/17/01 2:56 PM Page 58
[ ] Well Design
1.4.7
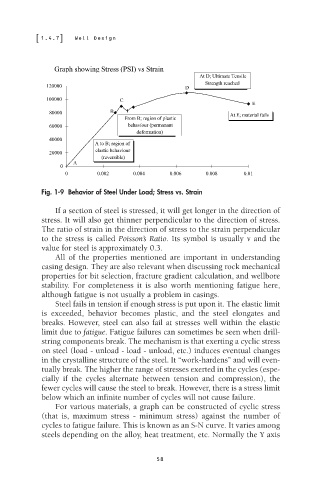
Graph showing Stress (PSI) vs Strain
At D; Ultimate Tensile
Strength reached
120000
D
100000 C
E
80000 B At E; material fails
From B; region of plastic
60000 behaviour (permanant
deformation)
40000
A to B; region of
elastic behaviour
20000
(reversible)
A
0
0 0.002 0.004 0.006 0.008 0.01
Fig. 1-9 Behavior of Steel Under Load; Stress vs. Strain
If a section of steel is stressed, it will get longer in the direction of
stress. It will also get thinner perpendicular to the direction of stress.
The ratio of strain in the direction of stress to the strain perpendicular
to the stress is called Poisson’s Ratio. Its symbol is usually v and the
value for steel is approximately 0.3.
All of the properties mentioned are important in understanding
casing design. They are also relevant when discussing rock mechanical
properties for bit selection, fracture gradient calculation, and wellbore
stability. For completeness it is also worth mentioning fatigue here,
although fatigue is not usually a problem in casings.
Steel fails in tension if enough stress is put upon it. The elastic limit
is exceeded, behavior becomes plastic, and the steel elongates and
breaks. However, steel can also fail at stresses well within the elastic
limit due to fatigue. Fatigue failures can sometimes be seen when drill-
string components break. The mechanism is that exerting a cyclic stress
on steel (load - unload - load - unload, etc.) induces eventual changes
in the crystalline structure of the steel. It “work-hardens” and will even-
tually break. The higher the range of stresses exerted in the cycles (espe-
cially if the cycles alternate between tension and compression), the
fewer cycles will cause the steel to break. However, there is a stress limit
below which an infinite number of cycles will not cause failure.
For various materials, a graph can be constructed of cyclic stress
(that is, maximum stress - minimum stress) against the number of
cycles to fatigue failure. This is known as an S-N curve. It varies among
steels depending on the alloy, heat treatment, etc. Normally the Y axis
58