
Page 129 - Pressure Swing Adsorption
P. 129
,I .I.
104 PRESSURE SWING ADSORPTION EQUILIBRIUM THEORY 105
i .0 cations are possible due to mult1ole conceivable values of the velocities and
~ the parameters 8, and 8. The compositions bounding the shock front are
o.~,.,
0.9 0.5~ ,-
0.171 constramed by the influent and effluent compositions, but due to entropic
o.,~2
0.#6
0.8 effects they may tend to lie somewhere between those. For multrcomponent
systems, the phenomenon of "rollup" can cause Joe.al maxima of the lighter
0.7 -
comoonents, resulting in a shock velocity slower or faster than expected.
0.6 - Subtleties anse because the choice 1s suhject to :a uniqueness condition.
4
<O Applications to PSA have been discussed by Kayser and Knaebel. When the
0.5 - curvature of the isotherms 1s not too severe (i.e., at Jew partial pressures), the
0.'4 - umoueness condition will be automatically satisfied, and the shock velocity
predicted by Eo. 4.9 will be valid for YA,~ YA, (i.e., the feed comoositron).
0.3 -
0.2
0.1 ' ' ' '
0 10 20 30 40 50 4.4 Cycle Analysis
Re
Certam orelirnmanes are essential for predicting PSA performance. First,
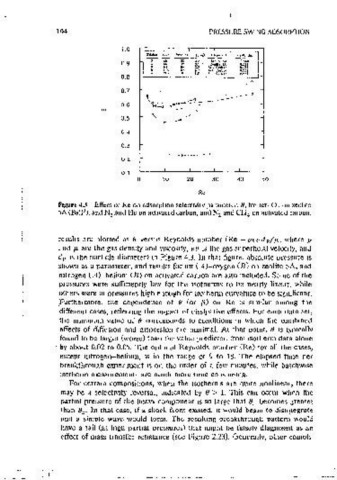
Figure 4.3 Effect of Re on adsorption selectivitv parameter, 0, for air-0 on zeolite one must determine basic properties, and among these, for the local equilib-
2
5
5A (Ball ), and N .and He on activated carbon, and N and CH on activated carbon. rium theory to be accurate, mass transfer resistances must be small. One
4
2
2
must then decide on the steps comprising the PSA cycle, and choose
operating conditmns, such as feed comoositmn, pressures, and step times. At
results are piotted as O versus Reynolds number (Re= pEvdp/µ, where p that point material balances and thermodynamic relatmnships can predict
and µ. are the gas density and v1scos1ty, eo 1s the gas superficial vcioc1ty, and over;ll p;rformance m terms of: flow rates, product recovery, byproduct
d p 1s the particle diameter) in Figure 4.3. In that figure, absolute pressure is comoosit10n, and power reamrements.
shown as a parameter, and results for a1r (A)-oxygen (B) on zeolite SA, and The key concept involved in applymg eauilibnurn :models is that each step
mtrogen (A)-helium (B) on acuvated carbon are also mcluded. Some of the is intended to accomplish a soecific change. For steps such as pressurization
pressures were suffictently low for the isotherms to be nearly linear, while and countercurrent blowctown, the specific change is .obvious. Other steps are
others were at pressures ·high enough for 1Sotherm curvature to be significant. more subtle because they may proceed until breakthrough 1s 1mmment,
Furthermore, the dependence of 0 (or (3) on Re is similar among the complete, or some fractron thereof. Such operating policres link the flow
different cases, reflecting the tmpact of dissipative effects. For each data set, rates, step times, bed size, etc. of those steps, and depending on mitial and
the mmunum value of O corresponds to conditions m which the combined final states, may impact other steps in the cycle. ln that sense the goals of the
effects of diffusion and dispersion are mmimaL At that oomt, 8 1s typically steps are not at all open ended.
found to be iarger (worse) than the vaiue predicted from isotherm data alone As an example of stepwise matenai balances" the number of moles
by about 0.02 to 0.05. The optimal Reynolds number (Re) for all the cases, ' I! contained in an influent or effluent stream cturmg any step can be determined
except mtrogen-helium, 1s in the range of 9 to 18. The elapsed time per from appropnate velocities, as grven by Eqs. 4.5, 4.7, 4.9, and 4. 10. The
breakthrough expenment is on the order of a few mmutes, while batchwise I ch01ce depends on the nature of the step. The rnol'es added to or removed
isotherm measurements are much more time consuming. from the column m each step can be expressed as the integral over time of
For certam comoositions, when the isotherms are Quite nonlinear, there the mstantaneous molar flow rate(s), or as the difference between the finai
may be a selec1tv1ty reversal, mdicated by 0 > I. This can occur when the and initial contents of the column. Generai exoress1bns are:
partial pressure of the heavy component 1s so large that O A becomes greater
than 8 • In that case, if a shock front existed, 1t would begin to dismtegrate
11 ( 4.13)
and a simple wave would form. The resulting breakthrough pattern would
have a tail (at high partial oressures) that might be falsely diagnosed as an
effect of mass transfer resistance (see Figure 2.23). Generally, other compli- (4.14)