
Page 209 - Primer on Enhanced Oil Recovery
P. 209
EOR on site implementation 197
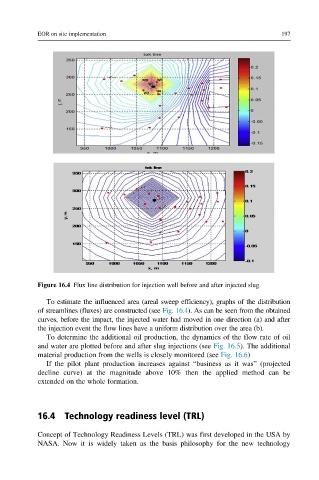
Figure 16.4 Flux line distribution for injection well before and after injected slug.
To estimate the influenced area (areal sweep efficiency), graphs of the distribution
of streamlines (fluxes) are constructed (see Fig. 16.4). As can be seen from the obtained
curves, before the impact, the injected water had moved in one direction (a) and after
the injection event the flow lines have a uniform distribution over the area (b).
To determine the additional oil production, the dynamics of the flow rate of oil
and water are plotted before and after slug injections (see Fig. 16.5). The additional
material production from the wells is closely monitored (see Fig. 16.6)
If the pilot plant production increases against “business as it was” (projected
decline curve) at the magnitude above 10% then the applied method can be
extended on the whole formation.
16.4 Technology readiness level (TRL)
Concept of Technology Readiness Levels (TRL) was first developed in the USA by
NASA. Now it is widely taken as the basis philosophy for the new technology