
Page 97 - Primer on Enhanced Oil Recovery
P. 97
88 Primer on Enhanced Oil Recovery
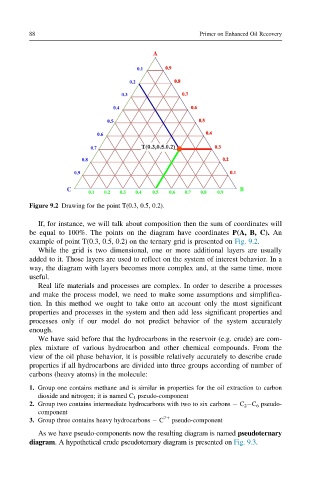
Figure 9.2 Drawing for the point T(0.3, 0.5, 0.2).
If, for instance, we will talk about composition then the sum of coordinates will
be equal to 100%. The points on the diagram have coordinates P(A, B, C). An
example of point T(0.3, 0.5, 0.2) on the ternary grid is presented on Fig. 9.2.
While the grid is two dimensional, one or more additional layers are usually
added to it. Those layers are used to reflect on the system of interest behavior. In a
way, the diagram with layers becomes more complex and, at the same time, more
useful.
Real life materials and processes are complex. In order to describe a processes
and make the process model, we need to make some assumptions and simplifica-
tion. In this method we ought to take onto an account only the most significant
properties and processes in the system and then add less significant properties and
processes only if our model do not predict behavior of the system accurately
enough.
We have said before that the hydrocarbons in the reservoir (e.g. crude) are com-
plex mixture of various hydrocarbon and other chemical compounds. From the
view of the oil phase behavior, it is possible relatively accurately to describe crude
properties if all hydrocarbons are divided into three groups according of number of
carbons (heavy atoms) in the molecule:
1. Group one contains methane and is similar in properties for the oil extraction to carbon
dioxide and nitrogen; it is named C 1 pseudo-component
2. Group two contains intermediate hydrocarbons with two to six carbons C 2 C 6 pseudo-
component
3. Group three contains heavy hydrocarbons C 71 pseudo-component
As we have pseudo-components now the resulting diagram is named pseudoternary
diagram. A hypothetical crude pseudoternary diagram is presented on Fig. 9.3.