
Page 98 - Primer on Enhanced Oil Recovery
P. 98
Ternary diagrams and miscible displacements 89
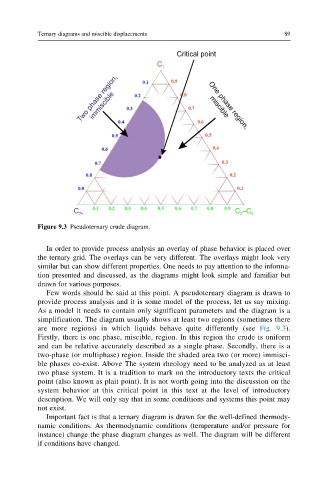
Figure 9.3 Pseudoternary crude diagram.
In order to provide process analysis an overlay of phase behavior is placed over
the ternary grid. The overlays can be very different. The overlays might look very
similar but can show different properties. One needs to pay attention to the informa-
tion presented and discussed, as the diagrams might look simple and familiar but
drawn for various purposes.
Few words should be said at this point. A pseudoternary diagram is drawn to
provide process analysis and it is some model of the process, let us say mixing.
As a model it needs to contain only significant parameters and the diagram is a
simplification. The diagram usually shows at least two regions (sometimes there
are more regions) in which liquids behave quite differently (see Fig. 9.3).
Firstly, there is one phase, miscible, region. In this region the crude is uniform
and can be relative accurately described as a single phase. Secondly, there is a
two-phase (or multiphase) region. Inside the shaded area two (or more) immisci-
ble phases co-exist. Above The system rheology need to be analyzed as at least
two phase system. It is a tradition to mark on the introductory texts the critical
point (also known as plait point). It is not worth going into the discussion on the
system behavior at this critical point in this text at the level of introductory
description. We will only say that in some conditions and systems this point may
not exist.
Important fact is that a ternary diagram is drawn for the well-defined thermody-
namic conditions. As thermodynamic conditions (temperature and/or pressure for
instance) change the phase diagram changes as well. The diagram will be different
if conditions have changed.