
Page 96 - Primer on Enhanced Oil Recovery
P. 96
Ternary diagrams and miscible 9
displacements
Abstract
Ternary diagrams allow to plot (e.g. represent, show) three variables with the total con-
stant sum of the coordinates (the grid construct) and then to combine the grid with an
overly of other information on top of it. An example grid is shown on Fig. 9.1.
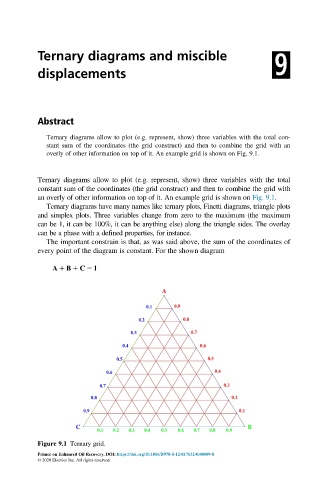
Ternary diagrams allow to plot (e.g. represent, show) three variables with the total
constant sum of the coordinates (the grid construct) and then to combine the grid with
an overly of other information on top of it. An example grid is shown on Fig. 9.1.
Ternary diagrams have many names like ternary plots, Finetti diagrams, triangle plots
and simplex plots. Three variables change from zero to the maximum (the maximum
can be 1, it can be 100%, it can be anything else) along the triangle sides. The overlay
can be a phase with a defined properties, for instance.
The important constrain is that, as was said above, the sum of the coordinates of
every point of the diagram is constant. For the shown diagram
A 1 B 1 C 5 1
Figure 9.1 Ternary grid.
Primer on Enhanced Oil Recovery. DOI: https://doi.org/10.1016/B978-0-12-817632-0.00009-8
© 2020 Elsevier Inc. All rights reserved.