
Page 144 - Principles of Applied Reservoir Simulation 2E
P. 144
Part II: Reservoir Simulation 129
at 2015 psia pressure. (B) Repeat A at a temperature of 150°F. (C) Explain the
differences in model performance. For this example, neglect the temperature
dependence of water properties. Refer to Chapter 24.6 for a description of
WINB4D fluid property input data.
Exercise 13.2 Data file CS-VC4.DAT is a vertical column model with four
layers. Layers K = 1, 3,4 are pay zones, and layer K = 2 is a shale layer. The
data set is a model of primary depletion of an initially undersaturated oil
reservoir. (A) Run CS-VC4.DAT for three years and show gas saturation in all
4 layers at the end of the run. You should see gravity segregation and the
formation of a gas cap in layer K = 3. (B) By referring to Chapter 25 and file
WTEMP.WEL, determine which model layers are being depleted through
wellbore perforations.
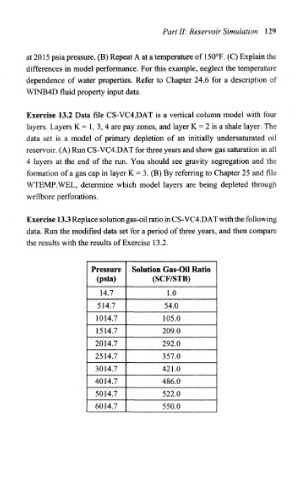
Exercise 13.3 Replace solution gas-oil ratio in CS-VC4.DAT with the following
data. Run the modified data set for a period of three years, and then compare
the results with the results of Exercise 13.2.
Pressure Solution Gas-Oil Ratio
(psia) (SCF/STB)
14.7 1.0
514.7 54.0
1014.7 105.0
1514.7 209.0
2014.7 292.0
2514.7 357.0
3014.7 421.0
4014.7 486.0
5014.7 522.0
6014.7 550.0