
Page 172 - Principles of Applied Reservoir Simulation 2E
P. 172
Part II: Reservoir Simulation 157
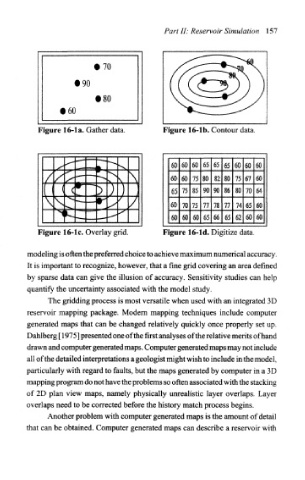
• 70
• 90
• 80
• 60
Figure 16-1 a. Gather data. Figure 16-lb. Contour data.
70
70 77 77 74
Figure 16-lc. Overlay grid. Figure 16-ld. Digitize data.
modeling is often the preferred choice to achieve maximum numerical accuracy.
It is important to recognize, however, that a fine grid covering an area defined
by sparse data can give the illusion of accuracy. Sensitivity studies can help
quantify the uncertainty associated with the model study.
The gridding process is most versatile when used with an integrated 3D
reservoir mapping package. Modern mapping techniques include computer
generated maps that can be changed relatively quickly once properly set up.
Dahlberg [ 1975] presented one of the first analyses of the relative merits of hand
drawn and computer generated maps. Computer generated maps may not include
all of the detailed interpretations a geologist might wish to include in the model,
particularly with regard to faults, but the maps generated by computer in a 3D
mapping program do not have the problems so often associated with the stacking
of 2D plan view maps, namely physically unrealistic layer overlaps. Layer
overlaps need to be corrected before the history match process begins.
Another problem with computer generated maps is the amount of detail
that can be obtained. Computer generated maps can describe a reservoir with