
Page 197 - Principles of Applied Reservoir Simulation 2E
P. 197
182 Principles of Applied Reservoir Simulation
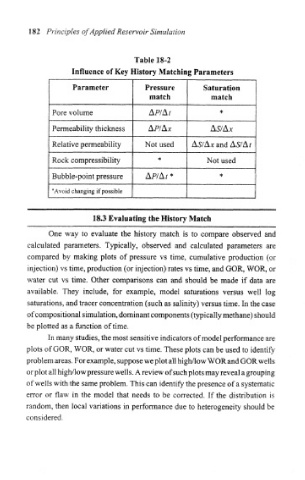
Table 18-2
Influence of Key History Matching Parameters
Parameter Pressure Saturation
match match
Pore volume AP/A/ *
Permeability thickness AP/A* AS/A*
Relative permeability Not used AS/ A* and AS/A/
Rock compressibility * Not used
Bubble-point pressure AP/A/ * *
* Avoid changing if possible
18.3 Evaluating the History Match
One way to evaluate the history match is to compare observed and
calculated parameters. Typically, observed and calculated parameters are
compared by making plots of pressure vs time, cumulative production (or
injection) vs time, production (or injection) rates vs time, and GOR, WOR, or
water cut vs time. Other comparisons can and should be made if data are
available. They include, for example, model saturations versus well log
saturations, and tracer concentration (such as salinity) versus time. In the case
of compositional simulation, dominant components (typically methane) should
be plotted as a function of time.
In many studies, the most sensitive indicators of model performance are
plots of GOR, WOR, or water cut vs time. These plots can be used to identify
problem areas. For example, suppose we plot all high/low WOR and GOR wells
or plot all high/low pressure wells. A review of such plots may reveal a grouping
of wells with the same problem. This can identify the presence of a systematic
error or flaw in the model that needs to be corrected. If the distribution is
random, then local variations in performance due to heterogeneity should be
considered.