
Page 202 - Principles of Applied Reservoir Simulation 2E
P. 202
Part II: Reservoir Simulation 187
also on commercial issues. Models let the user impose a variety of economic
constraints on future reservoir performance during the process of estimating
project life. These constraints reflect a range of economic criteria that will
interest management, shareholders, and prospective investors.
Commercial interests are clearly important to the future of a project, and
so are technical issues. It is often necessary to compare different recovery
processes as part of a study. Since there is only one field, it is unrealistic to
believe that many different recovery processes can be evaluated in the field, even
as small-scale pilot projects. Pilot projects tend to be substantially more
expensive to run than simulation studies. In some cases, however, it might be
worthwhile to confirm a simulation study with a pilot project. This is especially
true with expensive processes such as chemical and thermal flooding,
Yet another use for model predictions is the preparation of a reservoir
management plan. Reservoir management plans have been discussed in previous
sections. Their preparation is often the single most important motivation for
performing a simulation study.
19.2 Prediction Process
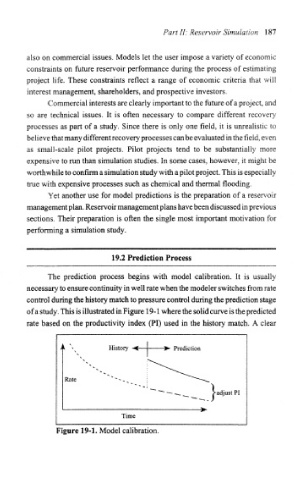
The prediction process begins with model calibration. It is usually
necessary to ensure continuity in well rate when the modeler switches from rate
control during the history match to pressure control during the prediction stage
of a study. This is illustrated in Figure 19-1 where the solid curve is the predicted
rate based on the productivity index (PI) used in the history match. A clear
History -< >• Prediction
Rate --,„ :
~"~~"~~ •—^ _ VadjustPI
Time
Figure 19-1. Model calibration.