
Page 210 - Principles of Catalyst Development
P. 210
CATALYST DEACTIVATION 199
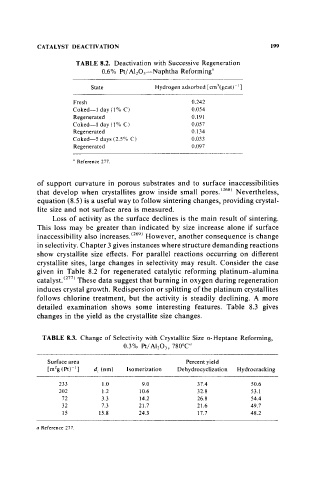
TABLE 8.2. Deactivation with Successive Regeneration
0.6% Pt/ Al203-Naphtha Reforming"
State Hydrogen adsorbed [cm\gcatj-I]
Fresh 0.242
Coked-I day (1 % C) 0.054
Regenerated 0.191
Coked-I day (I % C) 0.057
Regenerated 0.134
Coked-5 days (2.5% C) 0.033
Regenerated 0.097
" Reference 277.
of support curvature in porous substrates and to surface inaccessibilities
that develop when crystallites grow inside small pores. (268) Nevertheless,
equation (8.5) is a useful way to follow sintering changes, providing crystal-
lite size and not surface area is measured.
Loss of activity as the surface declines is the main result of sintering.
This loss may be greater than indicated by size increase alone if surface
inaccessibility also increases. (269) However, another consequence is change
in selectivity. Chapter 3 gives instances where structure demanding reactions
show crystallite size effects. For parallel reactions occurring on different
crystallite sites, large changes in selectivity may result. Consider the case
given in Table 8.2 for regenerated catalytic reforming platinum-alumina
catalyst. (277) These data suggest that burning in oxygen during regeneration
induces crystal growth. Redispersion or splitting of the platinum crystallites
follows chlorine treatment, but the activity is steadily declining. A more
detailed examination shows some interesting features. Table 8.3 gives
changes in the yield as the crystallite size changes.
TABLE 8.3. Change of Selectivity with Crystallite Size n-Heptane Reforming,
0.3% Pt/ A1 20 3 , 780°C"
Surface area Percent yield
[m2g(Pt)I] d, (nm) Isomerization Dehydrocyclization Hydrocracking
233 1.0 9.0 37.4 50.6
202 1.2 10.6 32.8 53.1
72 3.3 14.2 26.8 54.4
32 7.3 21.7 21.6 49.7
IS 15.8 24.3 17.7 48.2
a Reference 277.