
Page 214 - Principles of Catalyst Development
P. 214
CATALYST DEACTIVATION 203
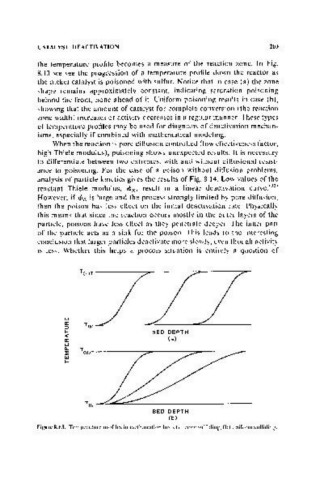
the temperature profile becomes a measure of the reaction zone. In Fig.
8.13 we see the progression of a temperature profile down the reactor as
the nickel catalyst is poisoned with sulfur. Notice that in case (a) the zone
shape remains approximately constant, indicating saturation poisoning
behind the front, none ahead of it. Uniform poisoning results in case (b),
showing that the amount of catalyst for complete conversion (the reaction
zone width) increases or activity decreases in a regular manner. These types
of temperature profiles may be used for diagnosis of deactivation mechan-
isms, especially if combined with mathematical modeling.
When the reaction is pore diffusion controlled (low effectiveness factor,
high Thiele modulus), poisoning shows unexpected results. It is necessary
to differentiate between two extremes, with and without diffusional resist-
ance to poisoning. For the case of a poison without diffusion problems,
analysis of particle kinetics gives the results of Fig. 8.14. Low values of the
reactant Thiele modulus, r:f>R, result in a linear deactivation curve. (32)
However, if r:f>R is large and the process strongly limited by pore diffusion,
then the poison has less effect on the initial deactivation rate. Physically
this means that since the reaction occurs mostly in the 0 uter layers of the
particle, poisons have less effect as they penetrate deeper. The inner part
of the particle acts as a sink for the poison. This leads to the interesting
conclusion that larger particles deactivate more slowly, even though activity
is less. Whether this helps a process situation is entirely a question of
T
TOUT
w
a:
::> TIN
~ BED DEPTH
«
a: (a)
w
c..
~ TOUT ~
w
~
TIN--~~~~~------------------------------
BED DEPTH
(b)
Figure 8.13. Temperature profiles in methanation beds (a) zone sulfiding, (b) uniform sulfiding.