
Page 67 - Principles of Catalyst Development
P. 67
54 CHAPTER 4
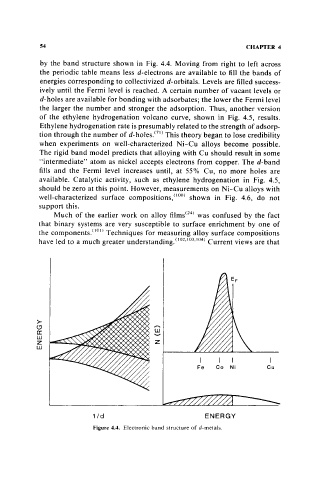
by the band structure shown in Fig. 4.4. Moving from right to left across
the periodic table means less d-electrons are available to fill the bands of
energies corresponding to collectivized d-orbitals. Levels are filled success-
ively until the Fermi level is reached. A certain number of vacant levels or
d-holes are available for bonding with adsorbates; the lower the Fermi level
the larger the number and stronger the adsorption. Thus, another version
of the ethylene hydrogenation volcano curve, shown in Fig. 4.5, results.
Ethylene hydrogenation rate is presumably related to the strength of adsorp-
tion through the number of d-holes.(7!1 This theory began to lose credibility
when experiments on well-characterized Ni-Cu alloys become possible.
The rigid band model predicts that alloying with Cu should result in some
"intermediate" atom as nickel accepts electrons from copper. The d-band
fills and the Fermi level increases until, at 55% Cu, no more holes are
available. Catalytic activity, such as ethylene hydrogenation in Fig. 4.5,
should be zero at this point. However, measurements on Ni-Cu alloys with
well-characterized surface compositions/ IOO ) shown in Fig. 4.6, do not
support this.
Much of the earlier work on alloy films(24) was confused by the fact
that binary systems are very susceptible to surface enrichment by one of
the components.I!D!) Techniques for measuring alloy surface compositions
have led to a much greater understanding. (102,103.104) Current views are that
>-
(;)
a:
w
z
w
Fe Co Ni Cu
1/d ENERGY
Figure 4.4. Electronic band structure of d·metals.