
Page 163 - Probability Demystified
P. 163
152 CHAPTER 9 The Normal Distribution
values < 36.44. Looking at the data, you can see all the data values fall
between 3.56 and 36.44.
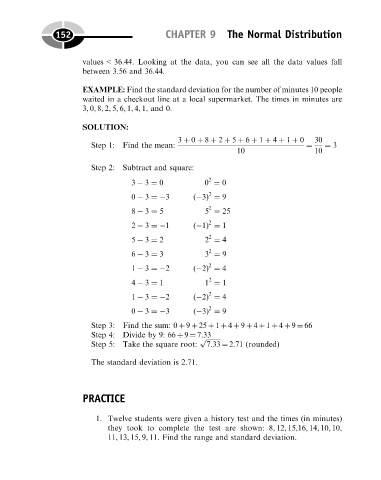
EXAMPLE: Find the standard deviation for the number of minutes 10 people
waited in a checkout line at a local supermarket. The times in minutes are
3, 0, 8, 2, 5, 6, 1, 4, 1, and 0.
SOLUTION:
3 þ 0 þ 8 þ 2 þ 5 þ 6 þ 1 þ 4 þ 1 þ 0 30
Step 1: Find the mean: ¼ ¼ 3
10 10
Step 2: Subtract and square:
2
3 3 ¼ 0 0 ¼ 0
2
0 3 ¼ 3 ð 3Þ ¼ 9
2
8 3 ¼ 5 5 ¼ 25
2
2 3 ¼ 1 ð 1Þ ¼ 1
2
5 3 ¼ 2 2 ¼ 4
2
6 3 ¼ 3 3 ¼ 9
2
1 3 ¼ 2 ð 2Þ ¼ 4
2
4 3 ¼ 1 1 ¼ 1
2
1 3 ¼ 2 ð 2Þ ¼ 4
2
0 3 ¼ 3 ð 3Þ ¼ 9
Step 3: Find the sum: 0 þ 9 þ 25 þ 1 þ 4 þ 9 þ 4 þ 1 þ 4 þ 9 ¼ 66
Step 4: Divide by 9: 66 9 ¼ 7.33
p ffiffiffiffiffiffiffiffiffi
Step 5: Take the square root: 7:33 ¼ 2.71 (rounded)
The standard deviation is 2.71.
PRACTICE
1. Twelve students were given a history test and the times (in minutes)
they took to complete the test are shown: 8, 12, 15,16, 14, 10, 10,
11, 13, 15, 9, 11. Find the range and standard deviation.