
Page 34 - Probability Demystified
P. 34
CHAPTER 2 Sample Spaces 23
point. Then from each branch of the first experiment draw branches that
represent the outcomes of the second experiment. You can continue the
process for further experiments of the sequence if necessary.
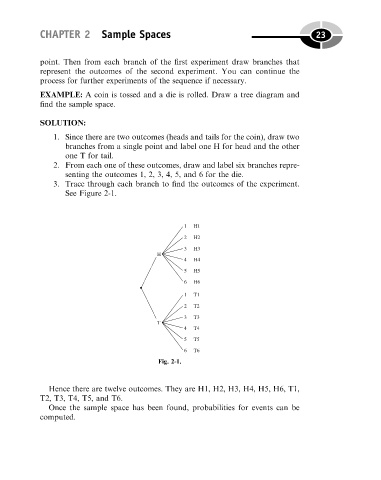
EXAMPLE: A coin is tossed and a die is rolled. Draw a tree diagram and
find the sample space.
SOLUTION:
1. Since there are two outcomes (heads and tails for the coin), draw two
branches from a single point and label one H for head and the other
one T for tail.
2. From each one of these outcomes, draw and label six branches repre-
senting the outcomes 1, 2, 3, 4, 5, and 6 for the die.
3. Trace through each branch to find the outcomes of the experiment.
See Figure 2-1.
Fig. 2-1.
Hence there are twelve outcomes. They are H1, H2, H3, H4, H5, H6, T1,
T2, T3, T4, T5, and T6.
Once the sample space has been found, probabilities for events can be
computed.