
Page 211 - Probability and Statistical Inference
P. 211
188 4. Functions of Random Variables and Sampling Distribution
arrive at the specific observed values i = 1, 2, ... for the sample mean
based on a sample of size n. In real life, however, it will be impossible to
replicate the process infinitely many times, but suppose instead that we repli-
cate one hundred times thereby coming up with the observed values i = 1,
2, ..., 100. One can easily draw a relative frequency histogram for this data
consisting of the observed values i = 1, 2, ..., 100. The shape of this
histogram will give us important clues regarding the nature of the theoretical
distribution of the sample mean, . If we generated more than one hundred
values, then the observed relative frequency histogram and the true pmf or
pdf of would have more similarities. With this perception of the indepen-
dent resampling again and again, the adjective sampling is attached when
we talk about the distribution of . In statistical applications, the sample
mean frequently arises and its theoretical distribution, as told by its pmf or the
pdf, is customarily referred to as the sampling distribution of . In the same
vein, one can think about the sampling distributions of many other character-
istics, for example, the sample median, sample standard deviation or the sample
maximum in a random sample of size n from an appropriate population under
consideration. In practice, for example, it is not uncommon to hear about the
sampling distribution of the median income in a population or the sampling
distribution of the record rainfall data in a particular state over a period. We
would use both phrases, the sampling distribution and distribution, quite inter-
changeably.
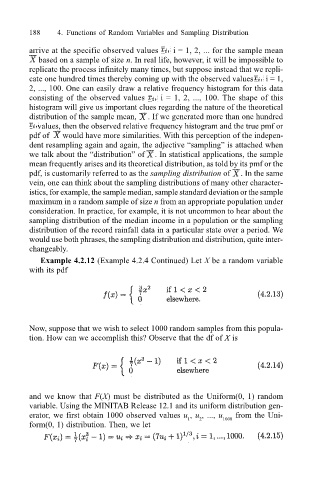
Example 4.2.12 (Example 4.2.4 Continued) Let X be a random variable
with its pdf
Now, suppose that we wish to select 1000 random samples from this popula-
tion. How can we accomplish this? Observe that the df of X is
and we know that F(X) must be distributed as the Uniform(0, 1) random
variable. Using the MINITAB Release 12.1 and its uniform distribution gen-
erator, we first obtain 1000 observed values u , u , ..., u 1000 from the Uni-
2
1
form(0, 1) distribution. Then, we let