
Page 212 - Probability and Statistical Inference
P. 212
4. Functions of Random Variables and Sampling Distribution 189
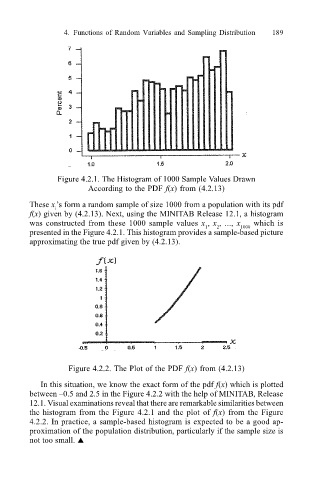
Figure 4.2.1. The Histogram of 1000 Sample Values Drawn
According to the PDF f(x) from (4.2.13)
These x s form a random sample of size 1000 from a population with its pdf
i
f(x) given by (4.2.13). Next, using the MINITAB Release 12.1, a histogram
was constructed from these 1000 sample values x , x , ..., x 1000 which is
2
1
presented in the Figure 4.2.1. This histogram provides a sample-based picture
approximating the true pdf given by (4.2.13).
Figure 4.2.2. The Plot of the PDF f(x) from (4.2.13)
In this situation, we know the exact form of the pdf f(x) which is plotted
between 0.5 and 2.5 in the Figure 4.2.2 with the help of MINITAB, Release
12.1. Visual examinations reveal that there are remarkable similarities between
the histogram from the Figure 4.2.1 and the plot of f(x) from the Figure
4.2.2. In practice, a sample-based histogram is expected to be a good ap-
proximation of the population distribution, particularly if the sample size is
not too small. !