
Page 25 - Probability and Statistical Inference
P. 25
2 1. Nations of Probability
observed:
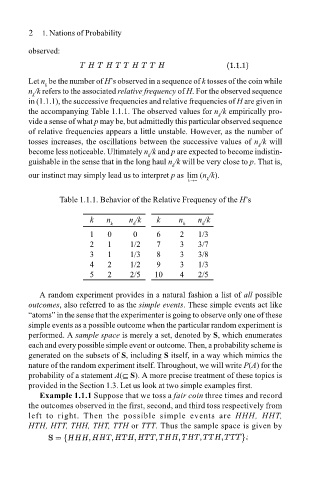
Let n be the number of Hs observed in a sequence of k tosses of the coin while
k
n /k refers to the associated relative frequency of H. For the observed sequence
k
in (1.1.1), the successive frequencies and relative frequencies of H are given in
the accompanying Table 1.1.1. The observed values for n /k empirically pro-
k
vide a sense of what p may be, but admittedly this particular observed sequence
of relative frequencies appears a little unstable. However, as the number of
tosses increases, the oscillations between the successive values of n /k will
k
become less noticeable. Ultimately n /k and p are expected to become indistin-
k
guishable in the sense that in the long haul n /k will be very close to p. That is,
k
our instinct may simply lead us to interpret p as lim (n /k).
k → ∞ k
Table 1.1.1. Behavior of the Relative Frequency of the Hs
k n n /k k n n /k
k k k k
1 0 0 6 2 1/3
2 1 1/2 7 3 3/7
3 1 1/3 8 3 3/8
4 2 1/2 9 3 1/3
5 2 2/5 10 4 2/5
A random experiment provides in a natural fashion a list of all possible
outcomes, also referred to as the simple events. These simple events act like
atoms in the sense that the experimenter is going to observe only one of these
simple events as a possible outcome when the particular random experiment is
performed. A sample space is merely a set, denoted by S, which enumerates
each and every possible simple event or outcome. Then, a probability scheme is
generated on the subsets of S, including S itself, in a way which mimics the
nature of the random experiment itself. Throughout, we will write P(A) for the
probability of a statement A(⊆ S). A more precise treatment of these topics is
provided in the Section 1.3. Let us look at two simple examples first.
Example 1.1.1 Suppose that we toss a fair coin three times and record
the outcomes observed in the first, second, and third toss respectively from
left to right. Then the possible simple events are HHH, HHT,
HTH, HTT, THH, THT, TTH or TTT. Thus the sample space is given by