Page 530 - Probability and Statistical Inference
P. 530
11
Likelihood Ratio and Other Tests
11.1 Introduction
In Chapter 8, a theory of UMP level a tests was developed for a simple null
hypothesis against a lower- or upper-sided alternative hypothesis. But, we
have mentioned that even in a one-parameter problem, sometimes a UMP
level a test does not exist when choosing between a simple null hypothesis
against a two-sided alternative hypothesis. Recall the situation from Section
8.5.1 in the case of testing the mean of a normal distribution with known
variance when the alternative hypothesis was two-sided. One may also recall
the Exercises 8.5.2, 8.5.4 and 8.5.5 in this context. In these situations, the
likelihood ratio tests provide useful methodologies. This general approach to
construct test procedures for composite null and alternative hypotheses was
developed by Neyman and Pearson (1928a,b,1933a,b).
We start with iid real valued random variables X , ..., X having a common
1
n
pdf f(x; θ) where the unknown parameter θ consists of p(≥ 1) components
p
(θ , ..., θ ) ∈ Θ(⊆ ℜ ). We wish to test
1 p
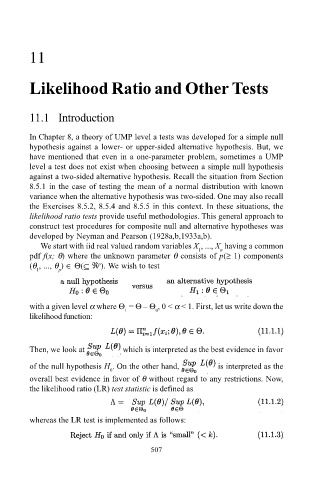
with a given level α where Θ = Θ Θ , 0 < α < 1. First, let us write down the
1
0
likelihood function:
Then, we look at which is interpreted as the best evidence in favor
of the null hypothesis H . On the other hand, is interpreted as the
0
overall best evidence in favor of θ without regard to any restrictions. Now,
the likelihood ratio (LR) test statistic is defined as
whereas the LR test is implemented as follows:
507

