Page 535 - Probability and Statistical Inference
P. 535
512 11. Likehood Ratio and Other Tests
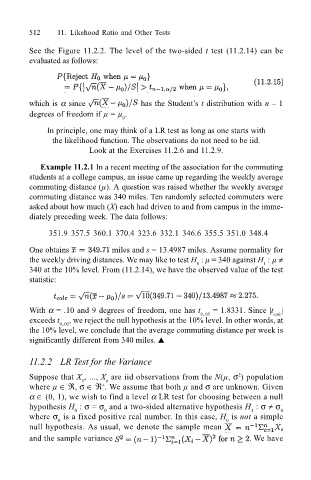
See the Figure 11.2.2. The level of the two-sided t test (11.2.14) can be
evaluated as follows:
which is α since has the Students t distribution with n 1
degrees of freedom if µ = µ .
0
In principle, one may think of a LR test as long as one starts with
the likelihood function. The observations do not need to be iid.
Look at the Exercises 11.2.6 and 11.2.9.
Example 11.2.1 In a recent meeting of the association for the commuting
students at a college campus, an issue came up regarding the weekly average
commuting distance (µ). A question was raised whether the weekly average
commuting distance was 340 miles. Ten randomly selected commuters were
asked about how much (X) each had driven to and from campus in the imme-
diately preceding week. The data follows:
351.9 357.5 360.1 370.4 323.6 332.1 346.6 355.5 351.0 348.4
One obtains miles and s = 13.4987 miles. Assume normality for
the weekly driving distances. We may like to test H : µ = 340 against H : µ ≠
1
0
340 at the 10% level. From (11.2.14), we have the observed value of the test
statistic:
With α = .10 and 9 degrees of freedom, one has t 9,.05 = 1.8331. Since |t |
calc
exceeds t 9,.05 , we reject the null hypothesis at the 10% level. In other words, at
the 10% level, we conclude that the average commuting distance per week is
significantly different from 340 miles. !
11.2.2 LR Test for the Variance
2
Suppose that X , ..., X are iid observations from the N(µ, σ ) population
1
n
where µ ∈ ℜ, σ ∈ ℜ . We assume that both µ and σ are unknown. Given
+
α ∈ (0, 1), we wish to find a level α LR test for choosing between a null
hypothesis H : σ = σ and a two-sided alternative hypothesis H : σ ≠ σ 0
0
1
0
where σ is a fixed positive real number. In this case, H is not a simple
0
0
null hypothesis. As usual, we denote the sample mean
and the sample variance We have

