
Page 544 - Probability and Statistical Inference
P. 544
11. Likehood Ratio and Other Tests 521
where the numbers c, d are chosen in such a way that the test has level α.
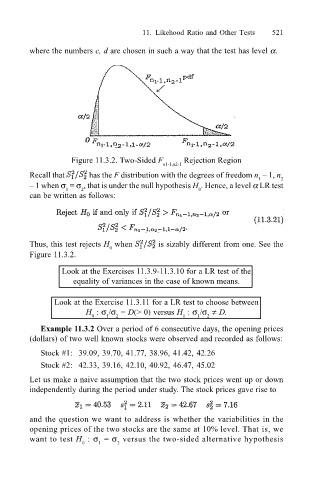
Figure 11.3.2. Two-Sided F Rejection Region
n1-1,n2-1
Recall that has the F distribution with the degrees of freedom n 1, n
1 2
1 when σ = σ , that is under the null hypothesis H . Hence, a level α LR test
1
0
2
can be written as follows:
Thus, this test rejects H when is sizably different from one. See the
0
Figure 11.3.2.
Look at the Exercises 11.3.9-11.3.10 for a LR test of the
equality of variances in the case of known means.
Look at the Exercise 11.3.11 for a LR test to choose between
H : σ /σ = D(> 0) versus H : σ /σ ≠ D.
0 1 2 1 1 2
Example 11.3.2 Over a period of 6 consecutive days, the opening prices
(dollars) of two well known stocks were observed and recorded as follows:
Stock #1: 39.09, 39.70, 41.77, 38.96, 41.42, 42.26
Stock #2: 42.33, 39.16, 42.10, 40.92, 46.47, 45.02
Let us make a naive assumption that the two stock prices went up or down
independently during the period under study. The stock prices gave rise to
and the question we want to address is whether the variabilities in the
opening prices of the two stocks are the same at 10% level. That is, we
want to test H : σ = σ versus the two-sided alternative hypothesis
0 1 2