
Page 560 - Probability and Statistical Inference
P. 560
11. Likehood Ratio and Other Tests 537
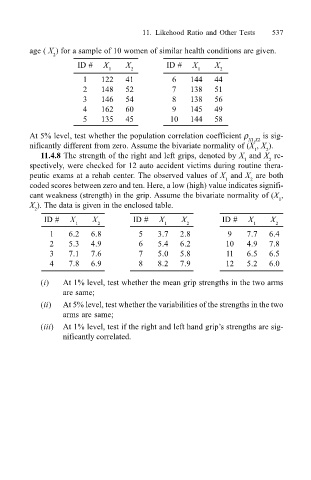
age ( X ) for a sample of 10 women of similar health conditions are given.
2
ID # X X ID # X X
1 2 1 2
1 122 41 6 144 44
2 148 52 7 138 51
3 146 54 8 138 56
4 162 60 9 145 49
5 135 45 10 144 58
At 5% level, test whether the population correlation coefficient ρ X1,X2 is sig-
nificantly different from zero. Assume the bivariate normality of (X , X ).
2
1
11.4.8 The strength of the right and left grips, denoted by X and X re-
2
1
spectively, were checked for 12 auto accident victims during routine thera-
peutic exams at a rehab center. The observed values of X and X are both
1 2
coded scores between zero and ten. Here, a low (high) value indicates signifi-
cant weakness (strength) in the grip. Assume the bivariate normality of (X ,
1
X ). The data is given in the enclosed table.
2
ID # X X ID # X X ID # X X
1 2 1 2 1 2
1 6.2 6.8 5 3.7 2.8 9 7.7 6.4
2 5.3 4.9 6 5.4 6.2 10 4.9 7.8
3 7.1 7.6 7 5.0 5.8 11 6.5 6.5
4 7.8 6.9 8 8.2 7.9 12 5.2 6.0
(i) At 1% level, test whether the mean grip strengths in the two arms
are same;
(ii) At 5% level, test whether the variabilities of the strengths in the two
arms are same;
(iii) At 1% level, test if the right and left hand grips strengths are sig-
nificantly correlated.