
Page 588 - Probability and Statistical Inference
P. 588
12. Large-Sample Inference 565
were started on this diet. After two weeks, the weight reduction for each
individual was recorded which gave the sample average 5.78 pounds and
standard deviation 1.12 pounds. Test a null hypothesis H : µ = 5 versus an
0
alternative hypothesis H : µ > 5 at an approximate 5% level.
1
12.3.5 A receptionist in a medical clinic thought that a patients average
(µ) waiting time to see one of the doctors exceeded twenty minutes. A ran-
dom sample of sixty patients visiting the clinic during a week gave the average
waiting time = 28.65 minutes and standard deviation s = 2.23 minutes. Can
the receptionists feeling regarding the average waiting time be validated at an
approximate 5% level?
12.3.6 (Exercise 12.3.5 Continued) Obtain an approximate 95% confi-
dence interval for the average (µ) waiting time for patients visiting the clinic.
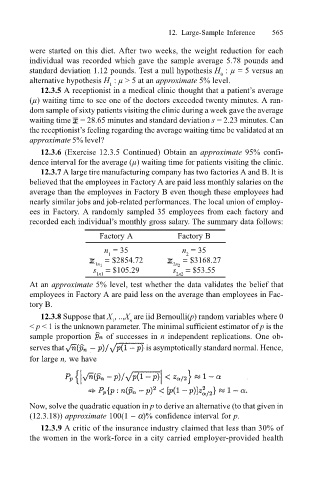
12.3.7 A large tire manufacturing company has two factories A and B. It is
believed that the employees in Factory A are paid less monthly salaries on the
average than the employees in Factory B even though these employees had
nearly similar jobs and job-related performances. The local union of employ-
ees in Factory. A randomly sampled 35 employees from each factory and
recorded each individuals monthly gross salary. The summary data follows:
Factory A Factory B
n = 35 n = 35
1
2
= $2854.72 = $3168.27
1n 1 2n 2
s = $105.29 s = $53.55
1n1 2n2
At an approximate 5% level, test whether the data validates the belief that
employees in Factory A are paid less on the average than employees in Fac-
tory B.
12.3.8 Suppose that X , ..,X are iid Bernoulli(p) random variables where 0
1
n
< p < 1 is the unknown parameter. The minimal sufficient estimator of p is the
sample proportion of successes in n independent replications. One ob-
serves that is asymptotically standard normal. Hence,
for large n, we have
Now, solve the quadratic equation in p to derive an alternative (to that given in
(12.3.18)) approximate 100(1 − α)% confidence interval for p.
12.3.9 A critic of the insurance industry claimed that less than 30% of
the women in the work-force in a city carried employer-provided health